Tracking – 2022 Economic Look Back
The U.S. Economy in 2022
We are calling 2022 the year of mixed signals. You can probably find a reference in every tracking we have done over the past year to strong economic indicators paralleling with weak ones. That stays true right the end of the year and entering 2023. For a focus on how the rail sector faired during 2022, see our companion 2022 State of Rail Review.
GDP
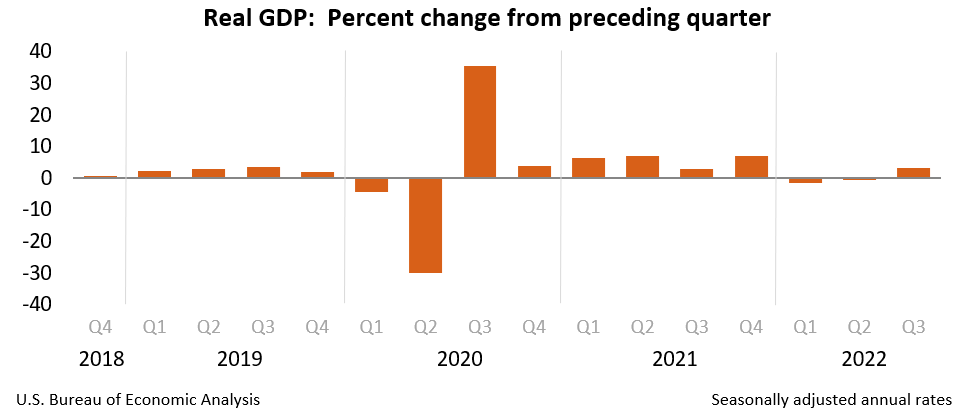
There are signs the economy is slowing. Preliminary 4th Quarter GDP numbers will be released January 26th. In the 3rd quarter U.S. real GDP returned to growth with a preliminary 3.2% growth rate. That is traditionally a strong growth rate but it averages with a -1.6% growth rate in Q1 and -.6% in the second quarter of 2022. As of December 14th, the conference board is forecasting .7% growth in the 4th quarter. Their total estimate for 2022 GDP is 1.9%. Worse than that, the conference board estimates 0% growth for 2023. We will see how those numbers develop as we get into the new year.
Jobs Report | Employment
Those economic indicators are certainly not definitive. One factor that remains strong in the economy is employment growth. We surpassed the total number of Jobs lost during the pandemic in August 2022. Almost two and a half years since we began recovery in May 2020. It takes a long time to get 20+ million jobs back. Since then, we have continued to create new jobs at an average pace of over 250,000/month. December was the first month in 2022 under 250,000 net new jobs created. Unemployment rates remain at historic lows near 3.5%. It will be hard to say we are in anything more than a shallow recession if the job market continues like this.
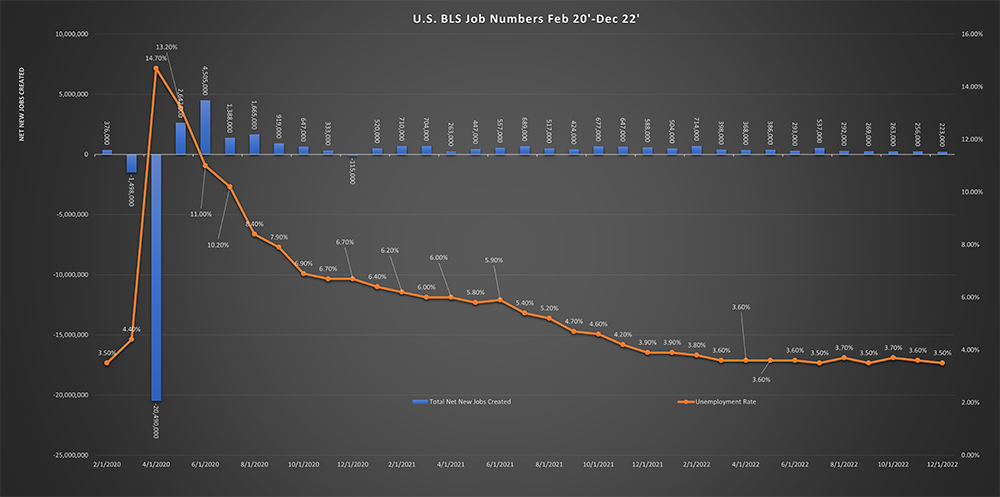
Through December we have created a little over 1.2 million additional jobs beyond what was lost at the beginning of the pandemic. Which way the seesaw teeters may be answered in 2023. Will companies continue to hire at this steady pace? Part of that depends on if they can continue to find workers to fill those positions.
We have been steady proponents of watching not only the headline unemployment report but the labor force participation rate and employment/population ratio. Put simply, what percentage of the population is actively involved in the work force.
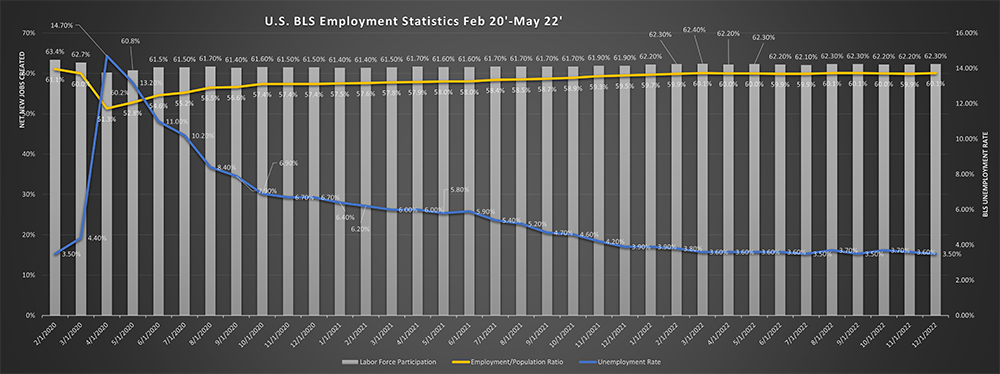
The labor force participation rate hit a post pandemic high of 62.4% in March of 2022. That is still a full 1% off of the 63.4% reading in February 2020. It has stalled there since. Since March the LFRP has hovered or dropped slightly and was recorded at 62.3% in December of 22. While we have an aging population, this indicates there may yet be some slack in the labor force. As inflation forces more people into, or back into, the labor force. We are curious to see if this returns to near pre pandemic levels.
Over the past several months, many employers have announced layoffs in their work forces. What is different in 2022 are the jobs lost are trending more toward technology companies and what are traditionally considered knowledge economy positions. High profile companies, like Amazon, Meta (facebook), and Salesforce have announced sizeable work force reductions over the past few months. For anyone who paid attention to the stock market in 2022. This is likely not surprising. The Nasdaq index closed 2022 down just over 33% for the year. Granted that is after several years of expanding multiples and outsized returns. One question for the check back in a year list. While the total number of layoffs have been relatively small. They are in traditionally higher paying roles. Will these layoffs have an outsized effect on consumer spending in 2023? What industries will fair better than others? Will lower cost retailers remain strong as jobs remain available for working class families? Only time will tell.
Economic Indicators:
Inflation
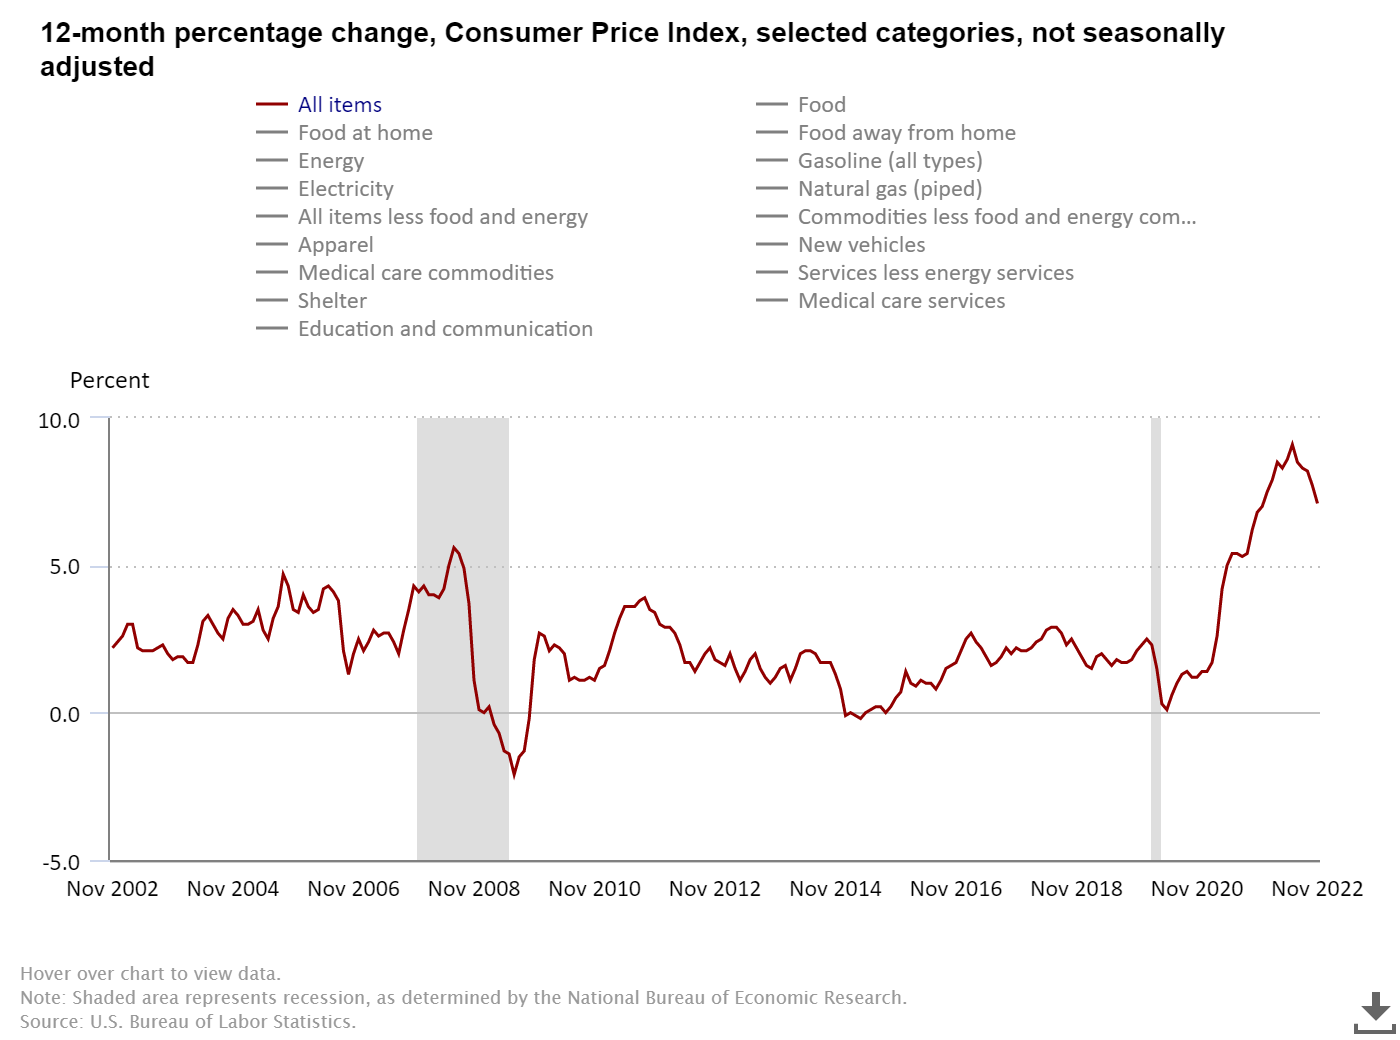
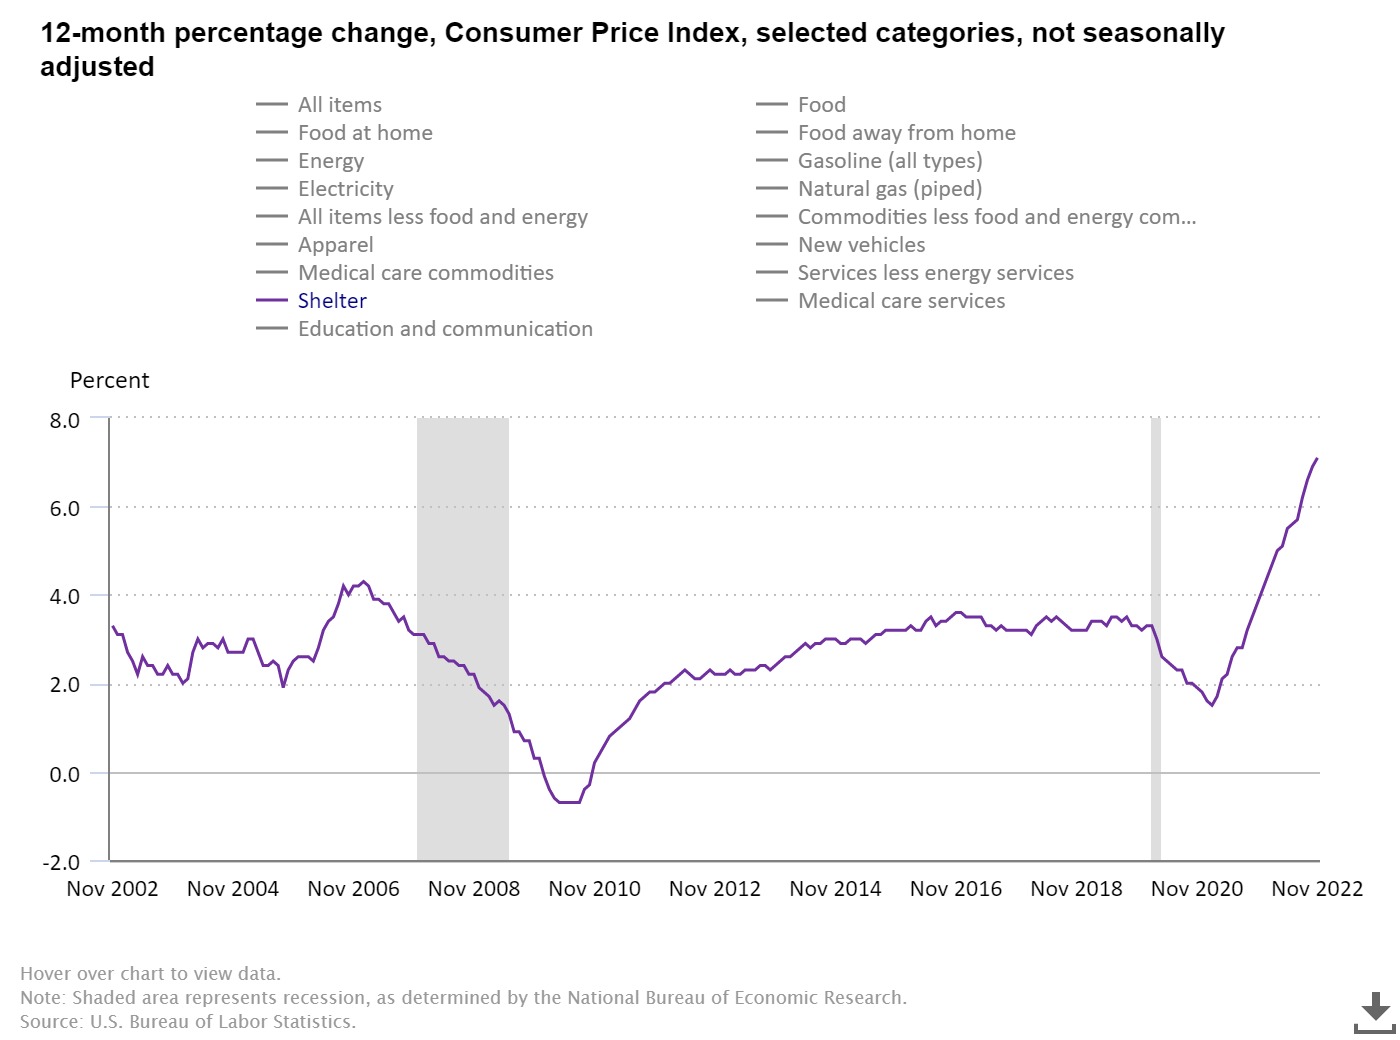
It may have been a few months since our last update, but the dreaded i word has not gone anywhere. Inflation continued to rage right through the end of the year. While it has tapered some the last few months. Inflation still remains at highly elevated levels. We may be getting some early signs of cracks in the inflation armor though. The BLS released its monthly inflation report on December 13, 2022. The November year over year CPI was 7.1%. That is the highest level in decades excluding recent history. It is the lowest reading since December 2021’s 7.0%. The far right of the chart above shows us coming down the mountain. You can see we still have a long way to go to get back to historic levels of less than 5%. For most of the 2010’s CPI averaged closer to 3%. Will the trend continue in 2023 returning to traditional levels? Time will tell. If commodities are any indication. We may have some relief coming in 2023. Oil prices have returned to the mid $70’s after touching $120 a barrel earlier this year. U.S. Natural gas futures touched $9 dollars in the summer. Currently, they are sitting around $3.70. That is still well over the less than $3 dollars they spent most of the 2010’s hovering around.
While energy prices are down. Other costs are certainly not. Shelter costs have yet to peak. Shelter hit a new recent high of 6.9% year over year in November. While mortgage originations are way down. Costs have continued to climb.
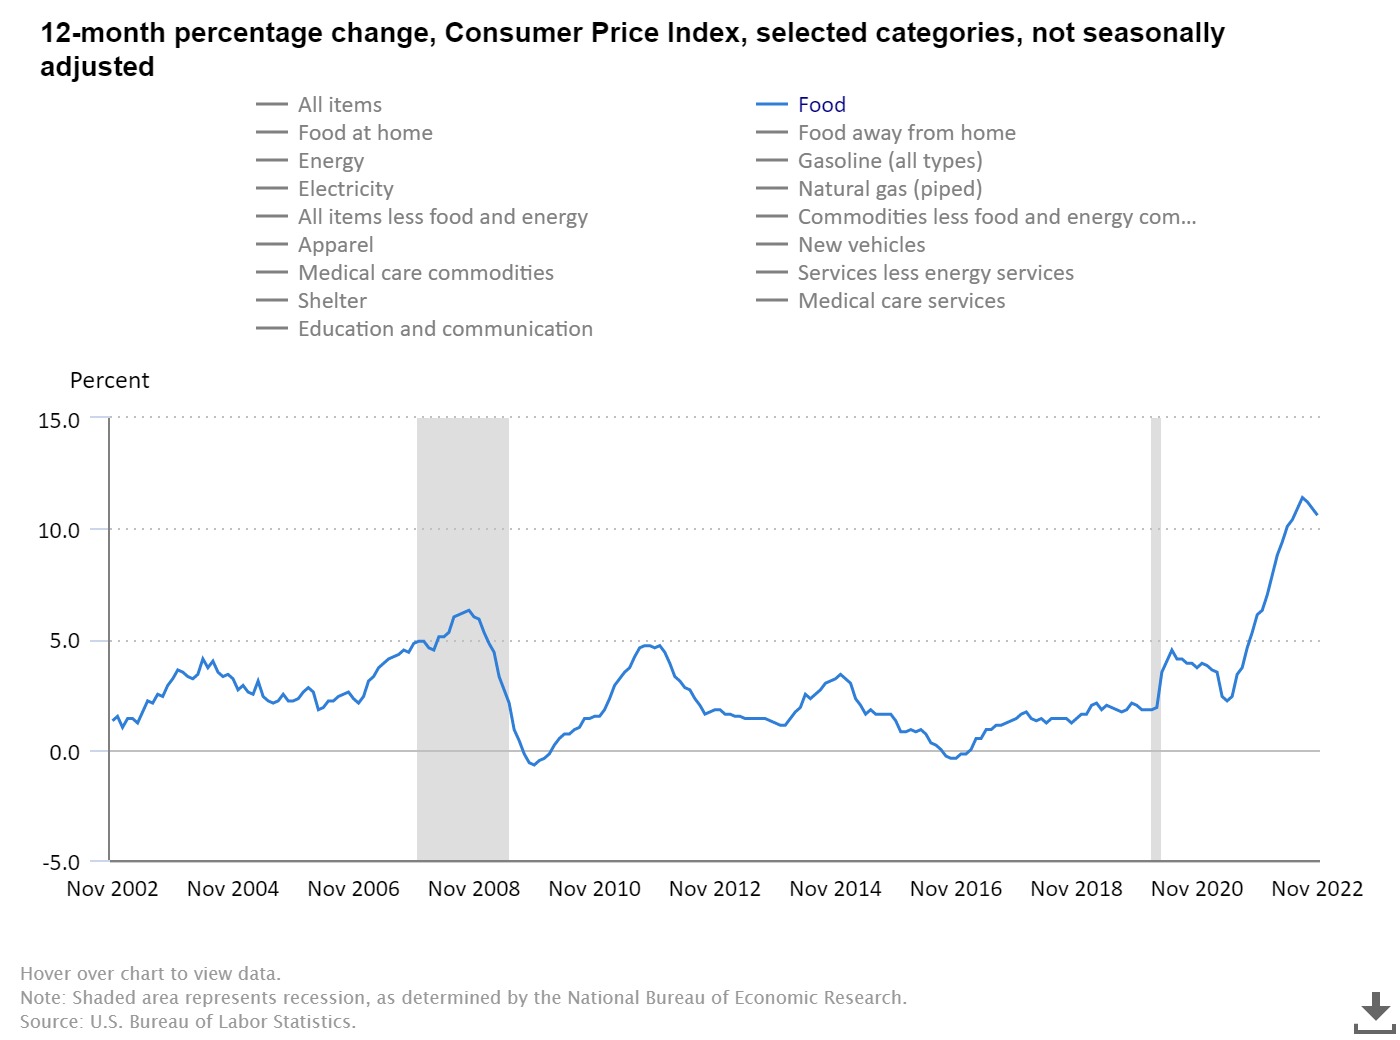
Food Costs were up 10.6% from a year ago November 2022. That’s down only slightly from an August peak high of 11.4%.
How does the federal reserve bring these inflation levels down without crashing the economy? That question has probably generated more CNBC segments over the last year than any other.
Industrial Output & Manufacturing
Total industrial output has remained largely flat over the past several months. According to the St. Louis Federal reserve bank, the November reading for Industrial output index was 102.8. When the federal reserve reversed economic policy and began raising interest rates in spring 2022, the industrial production rate ran into a wall. It has largely stayed there since.
.png)
The above Chart shows industrial output over the past 5 years. Where 2017 = 100 on the index. You can see we have gained steadily since the sharp rebound in summer 2020. In 2022 we largely leveled off. We measured as high as 102.5 in April of 22. December was only 102.8. inflation is off of the historic levels it saw back in fall and summer but is still sharply higher than it has been anytime in recent history.
Services PMI
In March, the Manufacturing PMI went under 50 for the first time in over a year. A reading below 50 indicates contraction. It has not been over 50 since. Services on the other hand have remained resilient throughout 2022. The ISM services PMI has been over 50 every month of 2022. It has been over 55% every month except 1. That was until December. The institute of supply management announced the services PMI dropped to 49.6% from a previous 56.5%. That is an enormous drop for one month by historic standards. We will be watching with a very close eye how things develop as we move in 2023. See our inflation section for more.
Consumer Spending:
Consumer spending for 2022 accounted for 72% of total U.S. GDP. It is the backbone of our economy. After a strong year. Consumer spending has begun tailing off into the end of the year.
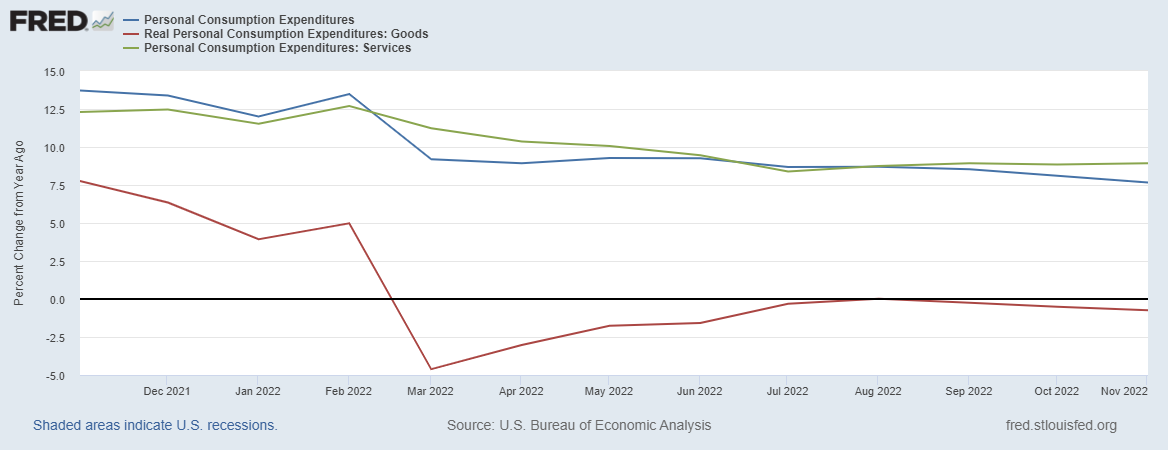
The blue line is overall year over year increase in total consumer spending. Orange is consumer spending on goods. You can see despite price inflation, total goods spending, which most directly affects the rail industry, has been largely negative since March of 2022. We attribute this largely to a “return to normalcy” during 2022. Where most services like restaurants and concert venues returned to normal or near normal activity levels. A month ago our question would have been how will lowered savings rates combined with a return to services spending affect goods going into 2023. With the services PMI drop in December, we can not help but wonder how the entire economy will shape up for 2023.
Savings Rate:
The consumer savings rate is one of our favorite measures of the strength of the consumer. We have looked at it before in our March 2021 State of Rail Report - we reported the historic level it had reached. In our June 2022 rail report, we showed how those levels had been entirely erased back to trend levels. From 2013 right up the pandemic personal savings rates have averaged above 5% and were trending closer to 10% right before the pandemic.

Unfortunately, in a time of historic inflation, that is no longer the case. The personal savings rate in November 2022 was 2.4%. in October 2022 it hit a 17 year low of 2.2%. The only time savings rates have been this low in recent history were from 2005-2007. We all remember what happened in 2008. We are not suggesting that is on the horizon, but it is not a data point we want to make comparisons with.
A NY fed report released November 2022 showed credit card balances showed a 38 billion dollar increase from the second quarter 2022. Credit card balances have returned to near record highs. They declined noticeably in the time immediately following the pandemic. That has all been erased. Even home equity lines of credit have begun increasing again. After peaking around 2008-2009. Heloc balances had been steadily coming down over the last decade plus. Heloc balances have increased by 3 billion dollars in Q2 2022. That is the second consecutive increase after years of declining levels.
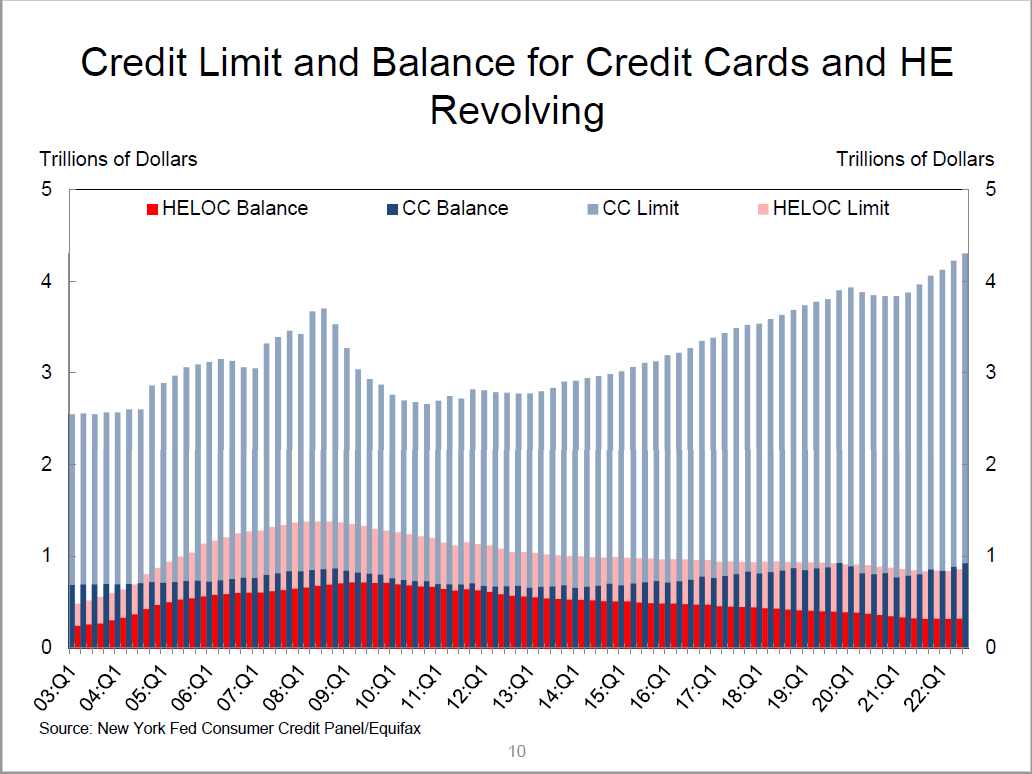
Like the country song goes, “Something’s gotta give.” While there is a large amount of untapped credit card limit capacity remaining. As long as inflation continues to outpace wage gains, consumers will continue finding it more and more difficult to cover essentials like groceries and transportation. When that happens, the first thing to go is discretionary spending. We’ll continue to watch this as 2023 moves forward.
2023 Ahead
What does the year ahead hold? Who’s to say. Our forecast of cloudy continues to carry us into 2023. Will the job market remain strong and drive wage gains through 2023? Will wage gains overtake inflation rates and increase consumers purchasing power? Will fed interest rates put the lid on inflation but snuff out the economy in the process? Will consumers continue to increase debt levels and spend on pent up pandemic activity demand? These are all questions we look forward to learning the answers to in 2023.
Andress Engineering Associates will continue to be here to support our customers with Trackmobile™, Modjoul™ smart belt, compressor, crane, and chiller needs.
Andress Engineering Associates has over 60 years as a Trackmobile Railcar Mover dealer and industrial Engineered equipment systems provider. We remain open and ready to support the operations of our customers. We have a fleet of Trackmobiles available for rental. Our service technicians are available 24/7/365. Our Trackmobiles, cranes, and compressors operate in some of the most critical industries supporting our economy. Our team stands ready to support your application in any way we can.
Sources: