Tracking – 2022 Rail Industry Look Back
2022 Railcar Traffic
It has certainly been an interesting 2022. The rail industry was no different. Just like the rest of the economy, railcar loadings were a series of mixed signals throughout the year. When the scores were all tallied up, total U.S. railcar loadings were down -.3% in 2022 vs 2021. Stripping out coal, loadings were down -1.4% from 2021. Grains and Metals were major contributors to the year over year downturn.
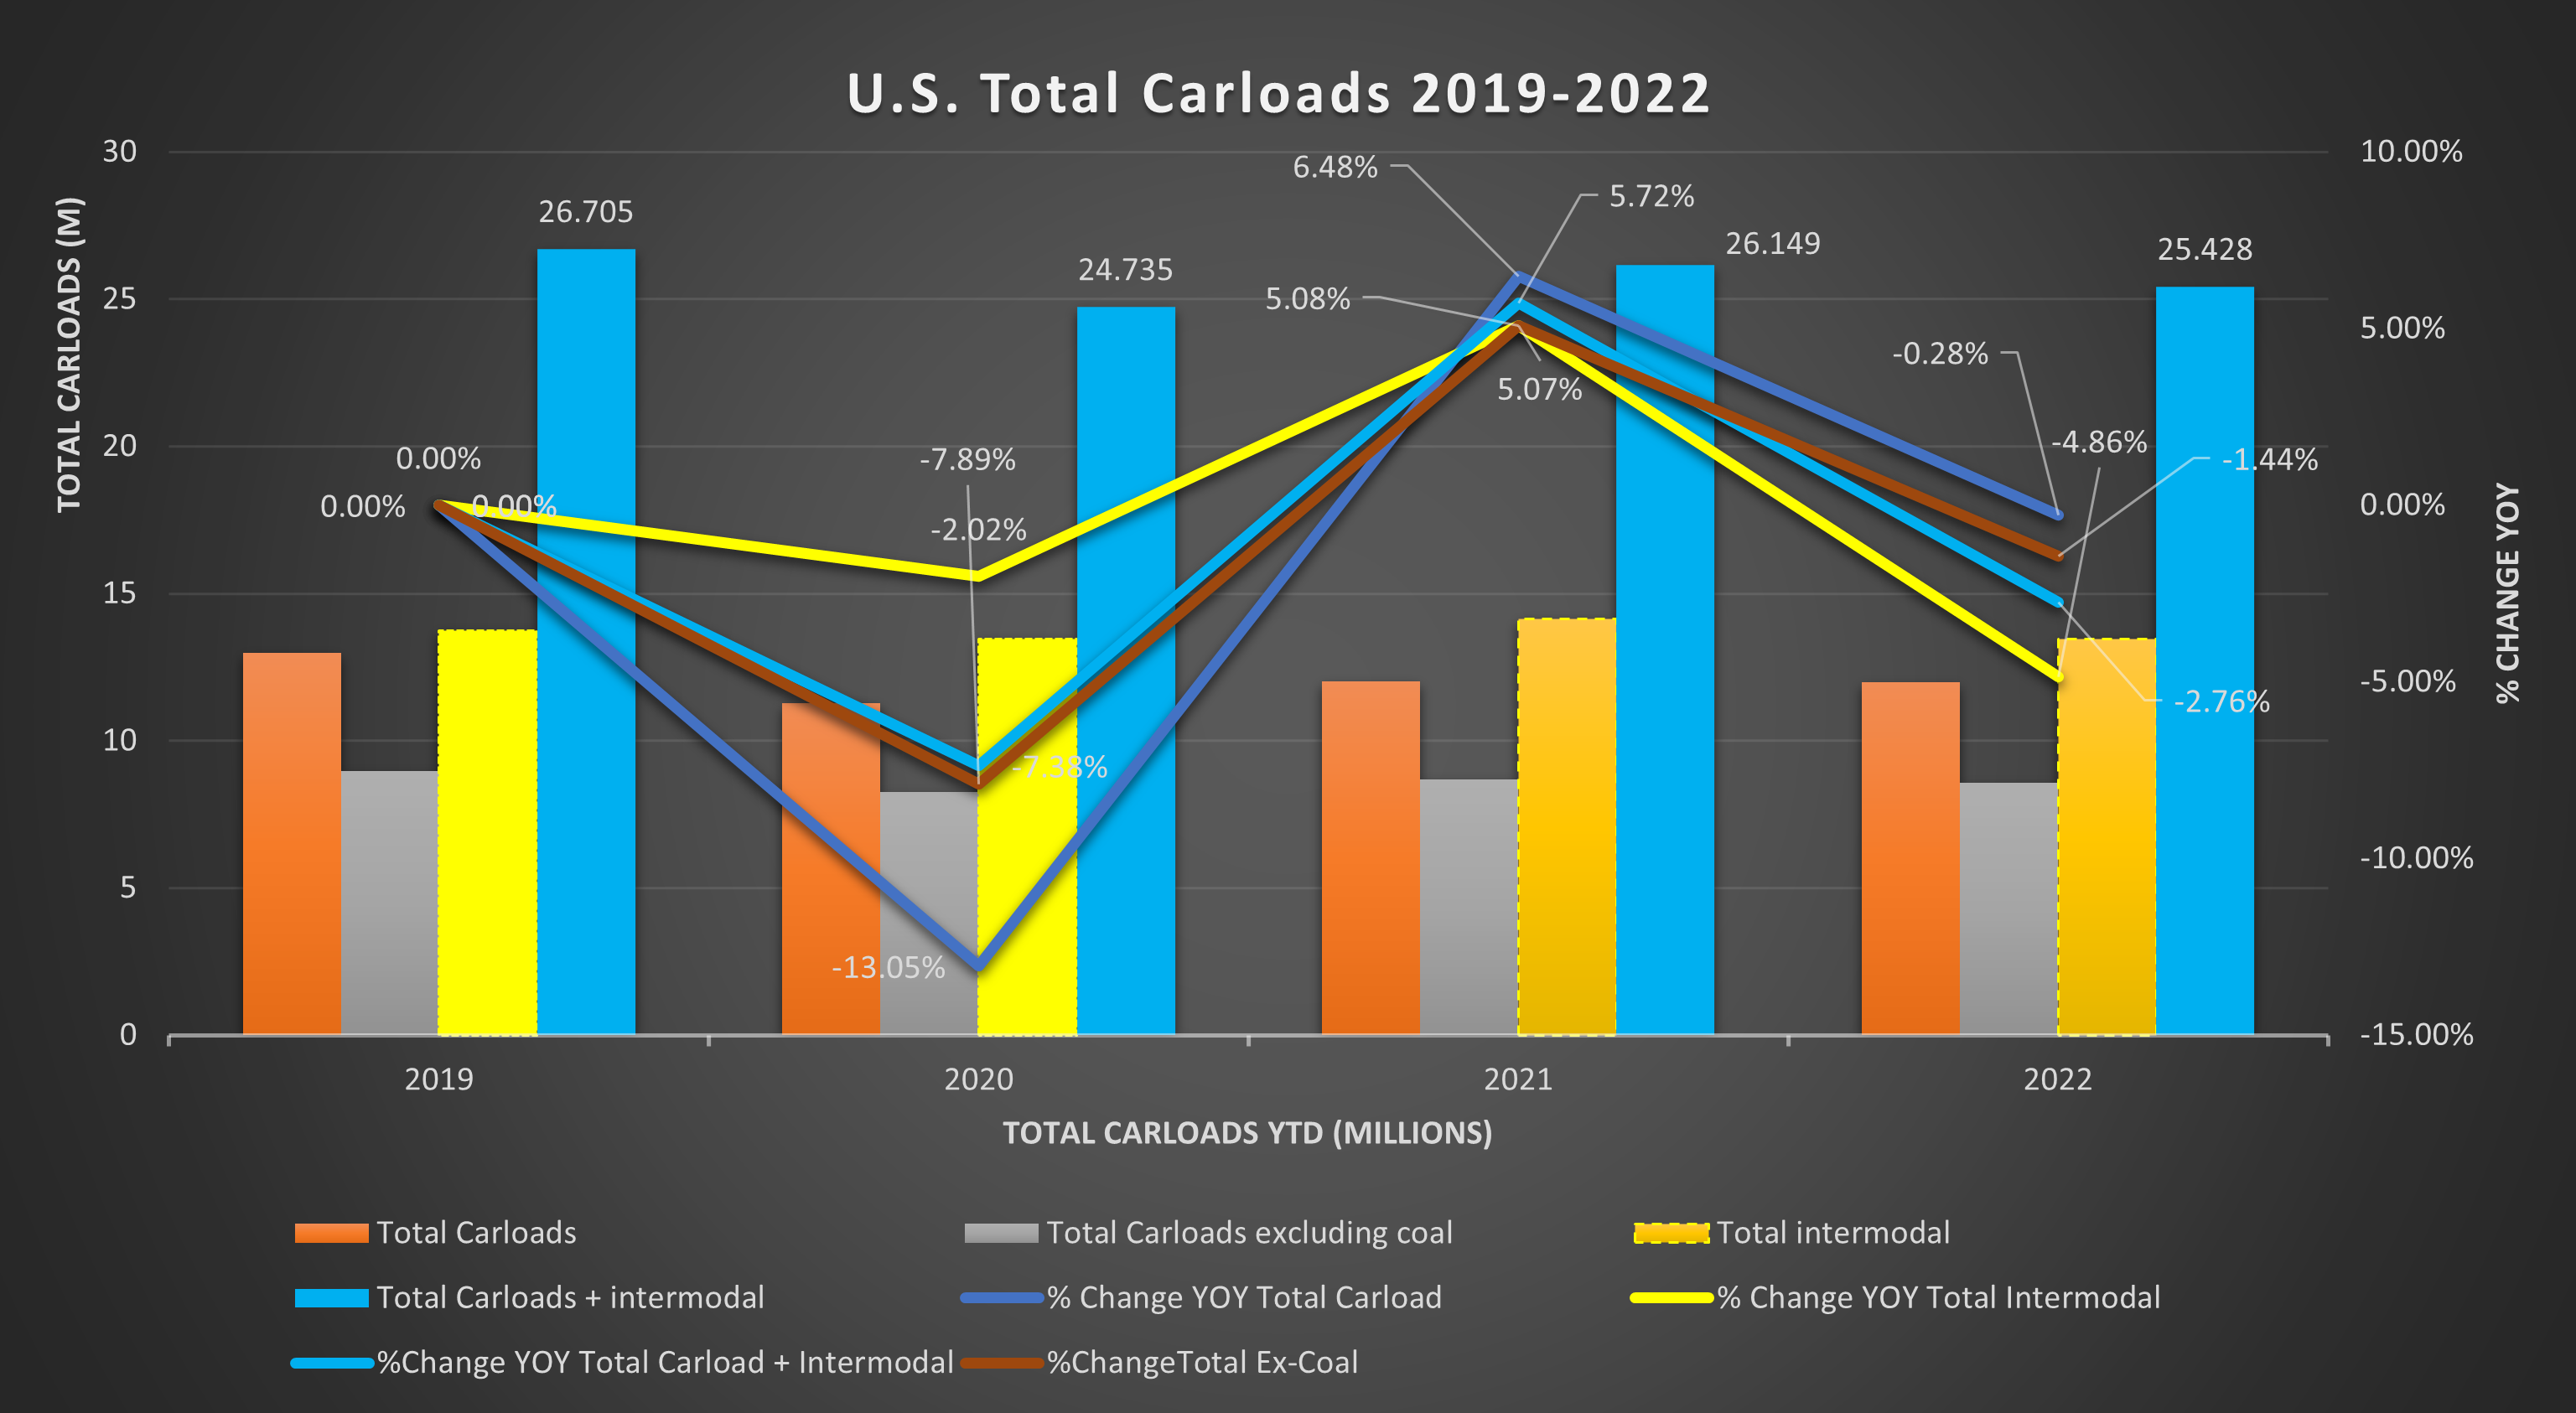
The gray bar on the chart above tells the story. 2022 and 2021 were both lower than 2019 non coal railcar loadings. Overall 2022 was the second lowest year since the 80’s for total railcar loadings including coal. Coal is a major contributor to that though. While it has seen a small resurgence in the last few years. Coal at its peak accounted for well over 30% of all U.S. railcar loadings. Coal loadings have dramatically declined over the past decade. Due mostly to coal power plants shutting down or converting to natural gas. Coal’s resurgence has largely been due to overseas exporting. Both Europe and Asia have increased coal usage over the past few years this has been accelerated by the war in Ukraine.
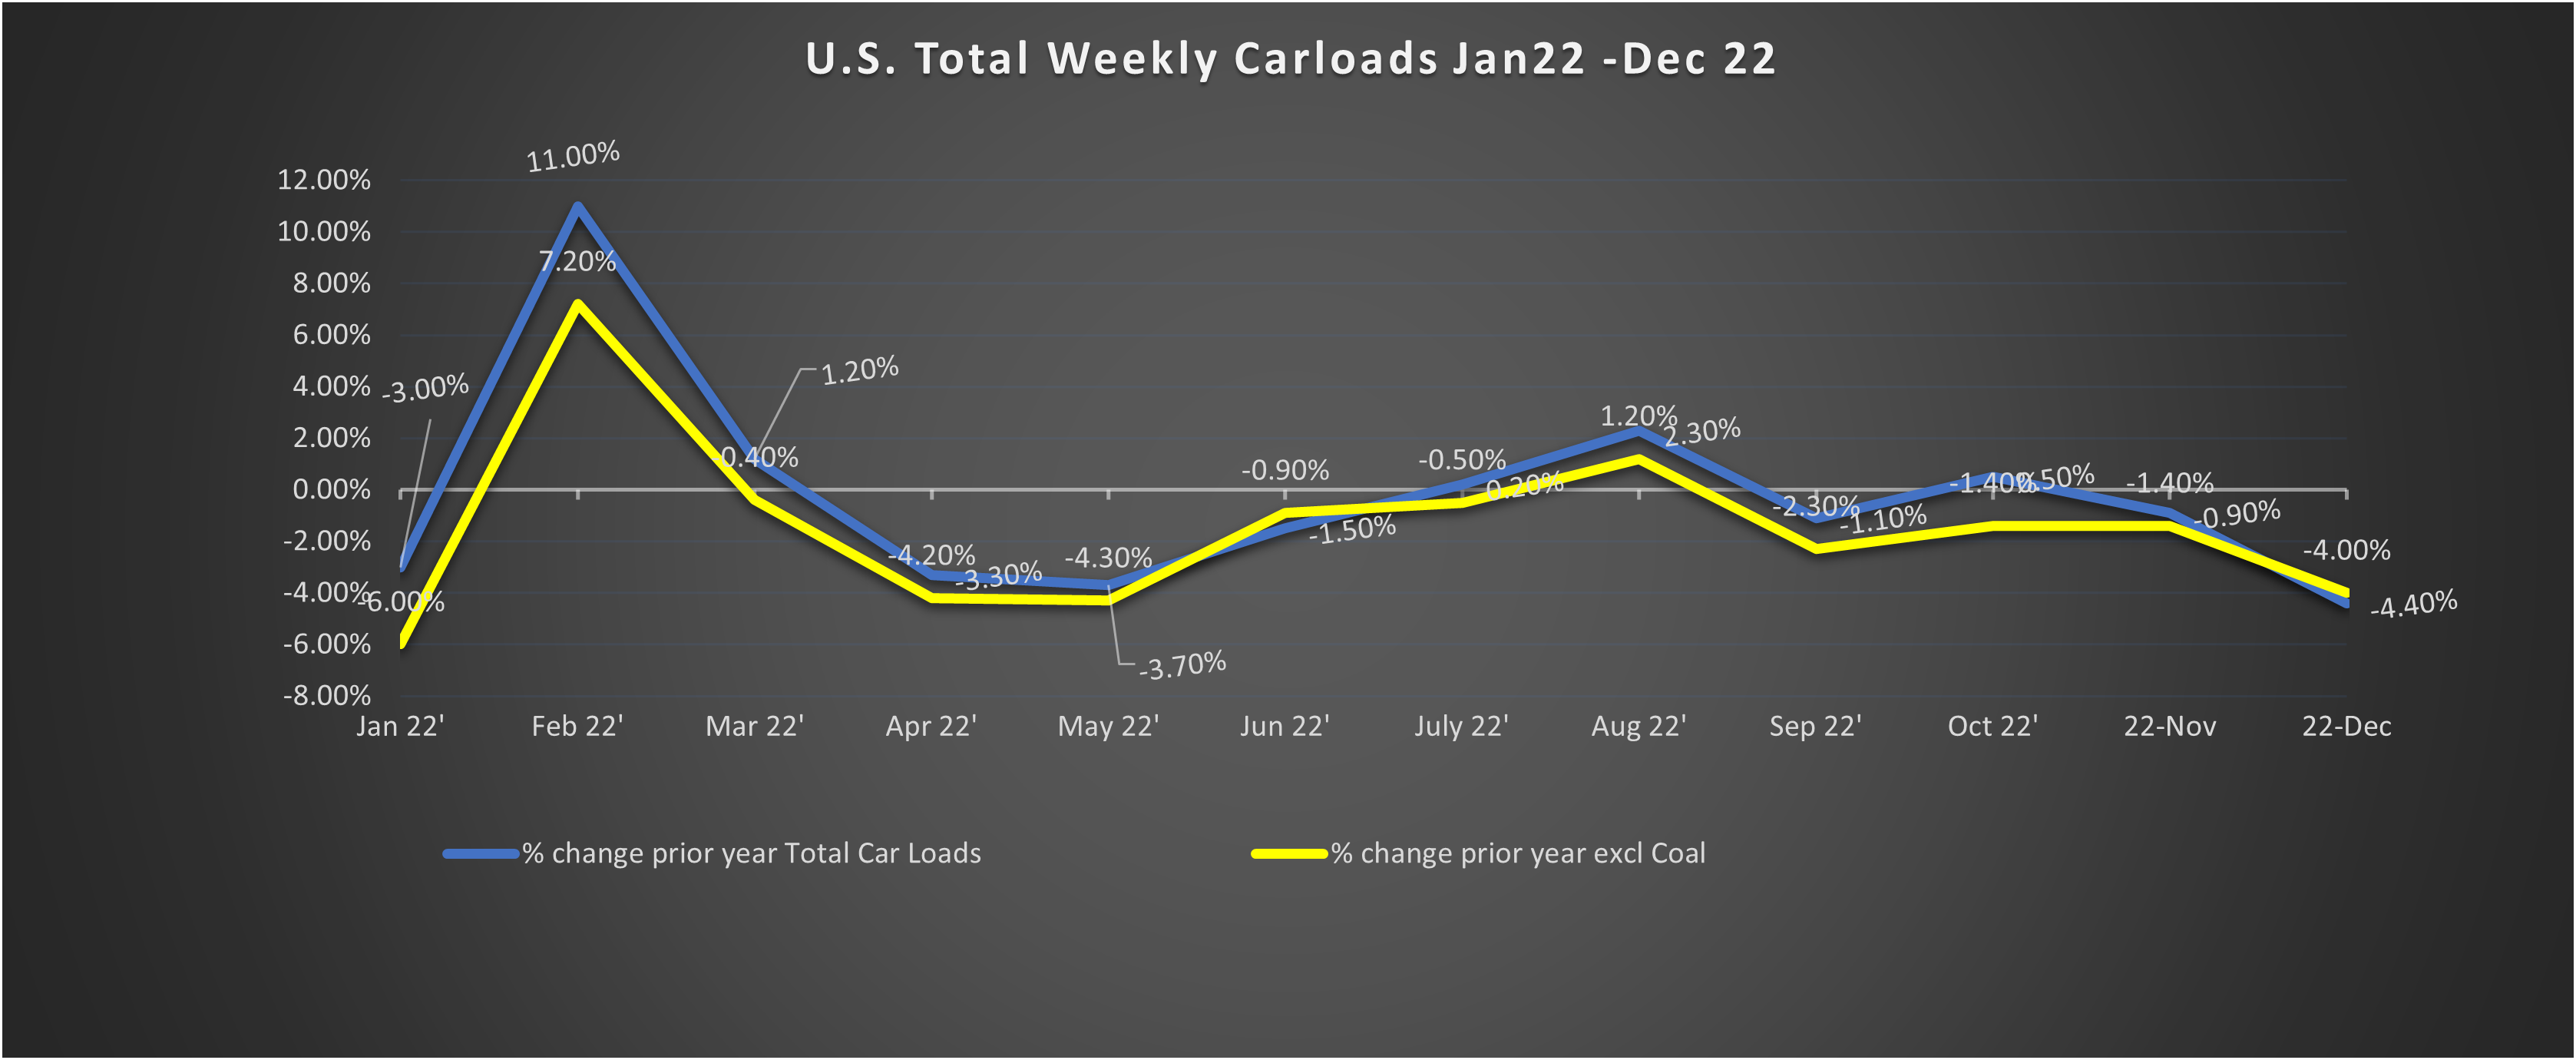
The story may be better told by the weekly average car load percentages chart above. The percentages are change in 2022 levels vs 2021 for the same month. February is an outlier as it overlapped the 2021 Texas ice storm that temporarily slowed rail shipments. We hovered at or slightly above 21 levels through the summer but fell off in the second and fourth quarters of 22. Like we said, the rail economy has been about as confusing as the rest of the economy.
One thing is for certain though, we saw it trailing off into the end of the year. What will the first quarter of 2023 look like?
Intermodal Railcars
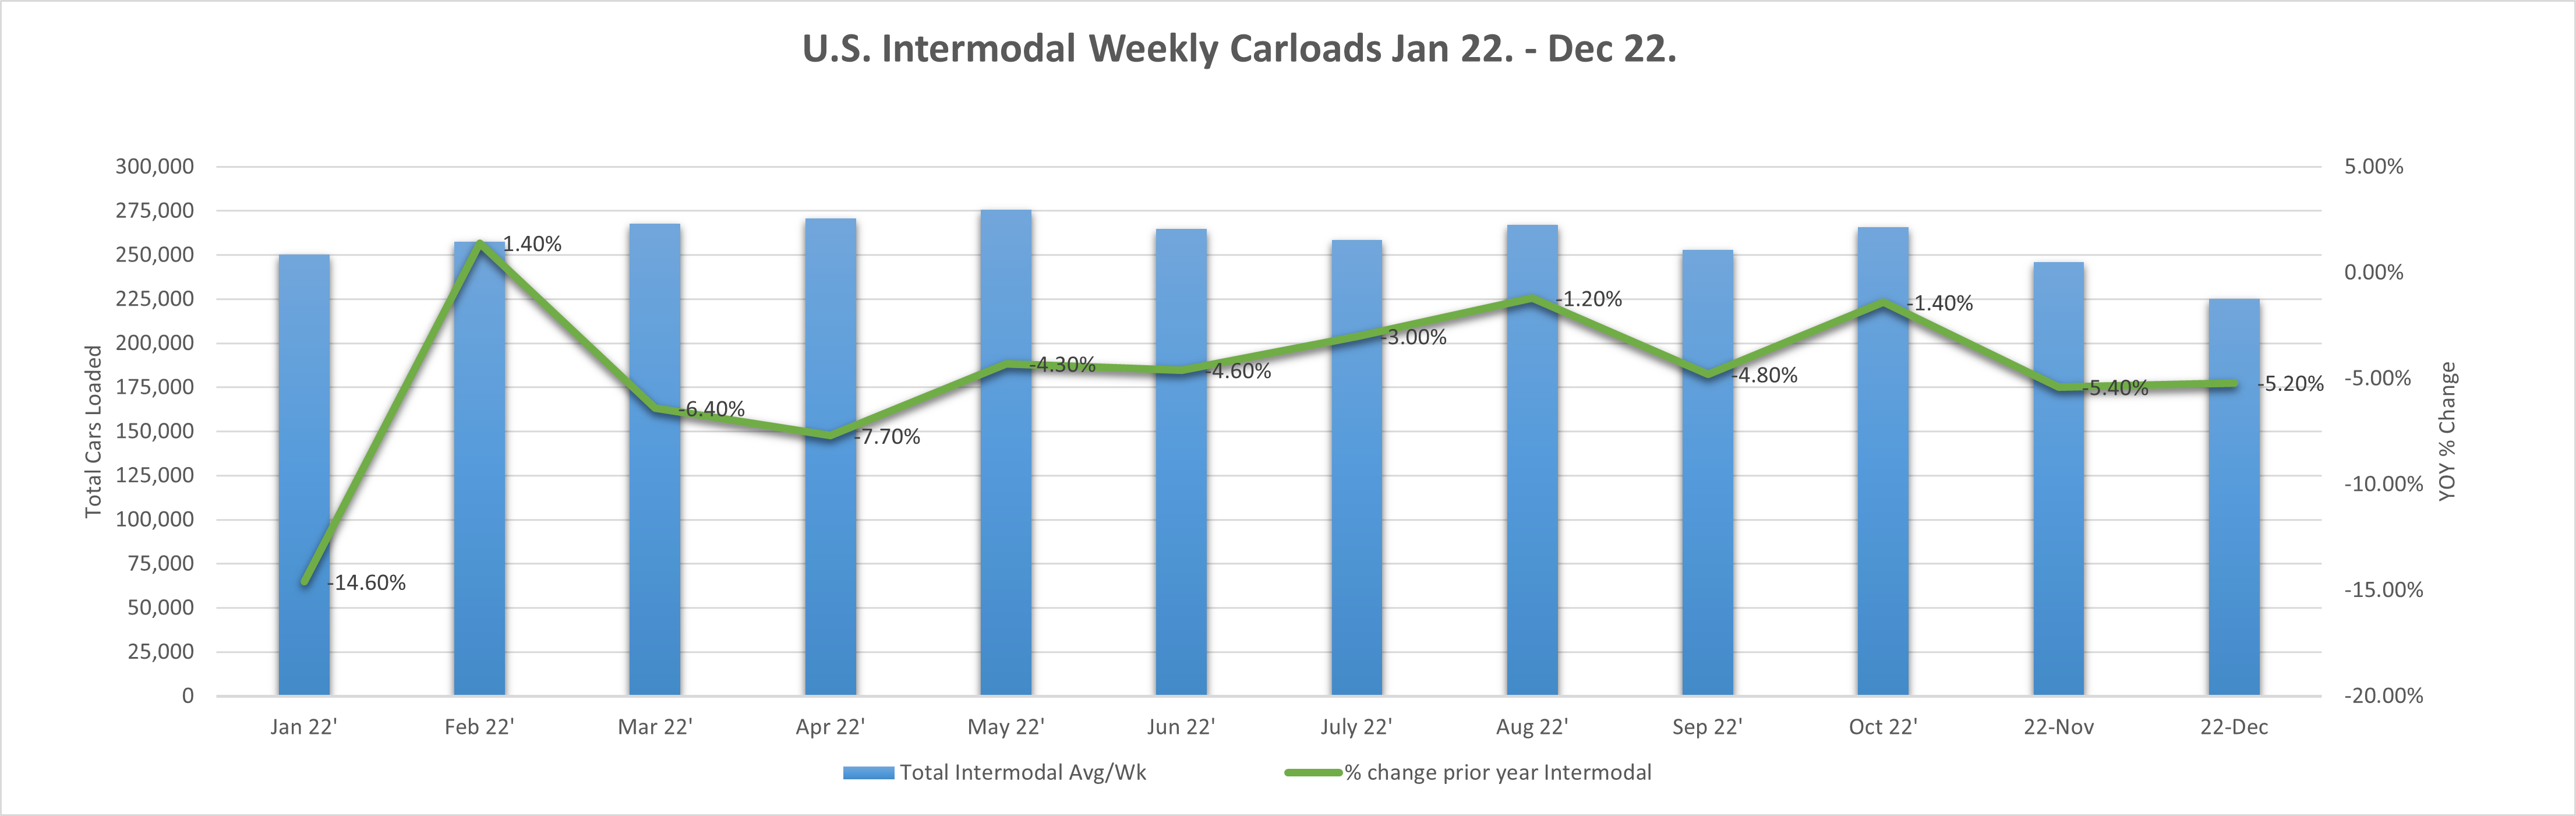
Intermodal loadings were down in 2022 from 2021. In 2022 total intermodal loadings were just over 13.45 million total car loads. That was down -4.9% from 2021 and the lowest total intermodal loading level since 2016. This is a considerable drop off after the records set the last couple of years.
Economy
There are signs the economy is slowing. Preliminary 4th Quarter GDP numbers will be released January 26th. In the 3rd quarter U.S. GDP returned to growth with a preliminary 3.2% growth rate. That is traditionally a strong growth rate but it averages with a -1.6% growth rate in Q1 and -.6% in the second quarter of 2022. As of December 14th, the conference board is forecasting .7% growth in the 4th quarter. Their total estimate for 2022 GDP is a subpar 1.9%. Worse than that, the conference board estimates 0% growth for 2023. We will see how those numbers develop as we get into the new year. For a further economic dive. See our 2022 Economic Review.
Rail Categories
What led to the decrease in railcar shipments in 2022? We mentioned above grain and metals. Of the AAR’s 20 tracked commodity categories, only 6 saw increases over 2021.
Agricultural shipments of which grain is the bulk accounted for a total of 16.7% of total rail shipments. They saw a total change of -1.3% in 2022 vs 2021. Grain specifically was down -4.2% just over 50,000 railcar loadings. It more than made up for increases in other agricultural categories.
Metallic ores and metals are 9.1% of the total U.S. railcar loadings. They fell a whopping -6.6% from 2021 levels. Primary metals and metallic ores were the causes of that. falling -9.0% and -8.9% respectively in 2022.
What were the 6 categories that saw gains in 2022?
- Coal. The biggest gainer was up 2.7%. or about 90,000 rail cars overs 2021.
- Crushed stone, sand , and gravel. Keeping the energy theme. The products used primarily in oil fracking were up 8.7% or 84,110 car loads.
- Motor Vehicles and Parts. After a year plus of fighting limited supply chains, car manufacturers finally started catching up in 2022. MVP carloads were up 6.5% or 25,574 car loads in 2022.
- Food products, a sub category of the agricultural products category were up 6.5% or about 20,000 car loads in 2022.
- Primary forest products were up 11.8%. They added 6,200 plus car loading in 2022.
- Grain mill products another agriculture sub category added 1.1% or 5,300 car loads. Having two ag categories in the gainers list illustrates the weight actual grain carries in that category.
2023, The Year Ahead
Will railcar loadings be up in 2023? Great question. The conference board is now forecasting 0% real U.S. gdp growth in 2023. We have a war that continues in the bread basket of Europe. While we never want to make light of something so horrible. We have to think that bodes well for 2023 U.S. grain and agriculture exports. China continues to open coal fired power plants. According to a September Reuters report China has approved 15GW of new coal power plants. Other developing countries are also expanding coal capacity. That said, The U.S. economy is certainly on a questionable footing going into the year. See our Economic 2022 Look Back report for a deeper dive.
Sources: