August Rail Report
Total Railcar Loads -11% off 2019
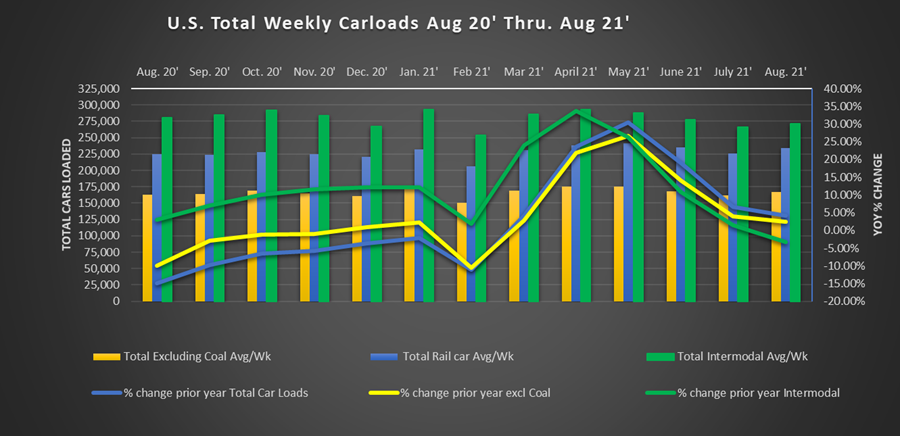
Muddling along, that is the feel of this economy and the rail industry. It may feel like a blur but we are now almost 18 months since the original Covid lockdowns that began in March 2020. For all of that time, we have had months where the economy felt like it was about to take off like a rocket ship, followed by months stuck on the launch pad. In August, the total weekly average railcar loadings were 233,691. Excluding coal, weekly railcar loadings were 167,140 or just 2.5% over August 2020 and -7.7% lower than August 2019.
August Freight Rail Traffic:
August saw a 4.1% increase in total U.S. domestic freight cars loaded compared with August 2020. In August 2020, we were still heavily in lockdowns in many places in the U.S. and still in the throws of Covid. Further, the standout bright spot of intermodal loadings saw their first year-over-year declines since June 2020. What was the cause of this month’s lackluster traffic? The Delta variant of Covid and corresponding increased government restrictions have got to be the first place you point. The U.S. remains in a spike of case outbreaks as the Delta variant works its way through the country. Supply chain issues remain a major focus as well. Continued delays in port congestion have been an ongoing issue for overall U.S. freight. The railroads do not escape this. Parts shortages remain a major concern and do not yet show signs of dissipating. While certain commodities like lumber have backed off in recent months. Many commodity prices remain at highs. The inflation rate for PPI is up 8.2% over August 2020, the highest increase since the metric began being tracked in 2010. New automobile sales in August were the lowest in over a year. Autos have not backed off for lack of demand but for lack of parts. Dealers do not have cars to sell. It could be months and well into 2022 before supply chain disruptions work themselves out in a significant way.
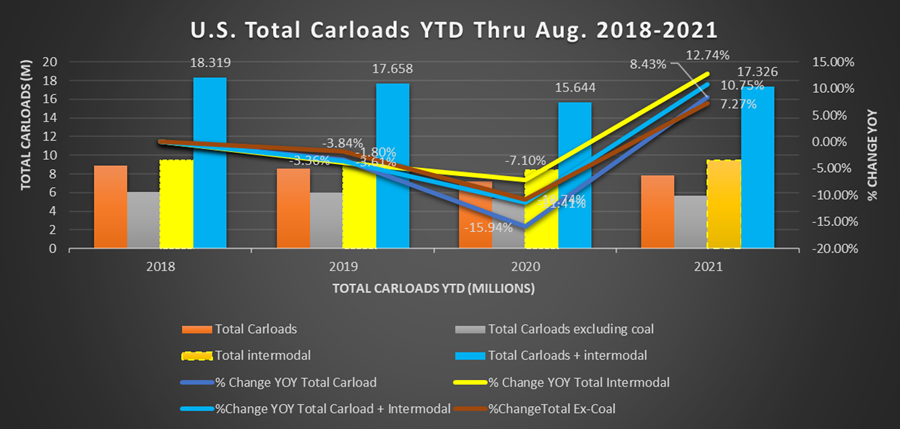
So far this year Total carloads (including coal) are 7.842 million cars loaded, up 8.4% over 2020, but down -11.4% from this point in 2019. That is not exactly the stunning recovery you hope to see from “historic” declines and pent-up demands. Ex-coal carloads through August are up 7.3% over 2020, but still down -7.7% from this point in 2019. Finally, total intermodal carloads through August 2020 were 9.48 million shipments. While August was the first down month since Summer 2020, intermodal is still up 12.7% over this time last year, and 4.1% over 2019.
The Economy:
Muddling, the word of the month. The U.S. Bureau of Labor Statistics announced on 9/3/2021 a paltry 235,000 net new non-farm jobs added in August 2021. After a revised June of 962,000 and July 1.053 million. 235,000 is a sharp drop and illustrates our point perfectly. “Just when I think I’m out, they pull me back in.”
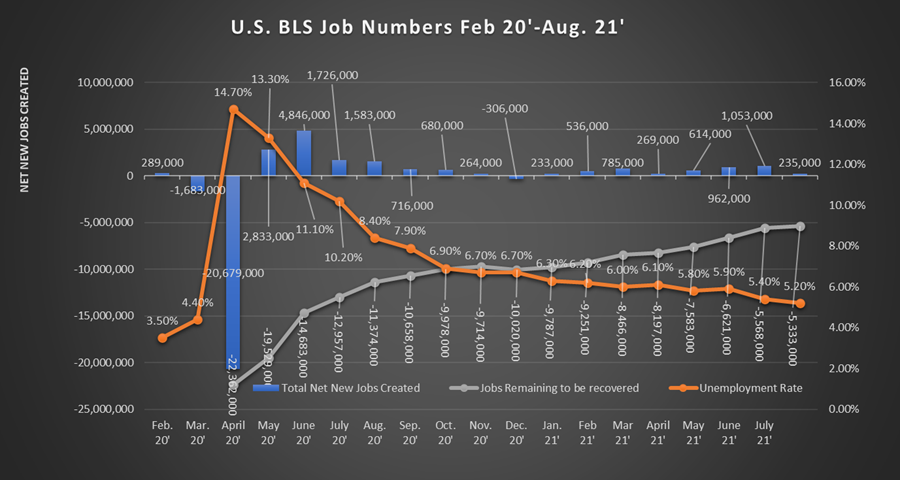
With this month’s reading, the unemployment rate was lowered to 5.2%. largely due to decreases in the active workforce rather than new jobs. The reductions seem to have fallen heavily on service sector-related jobs, specifically those industries most heavily Covid and lockdown affected. Employment in leisure and hospitality was unchanged in August 2021. While even may not sound so bad, this sector has added an average of 350,000 new net jobs per month over the prior six months. If we are going to see the continued 800K + monthly job adds, a big percentage of that will have to come from the service sector.
Other sectors were slight gains or unchanged with no major standouts.
Other economic indicators point to varying levels of expansion.
The purchasing manufacturer’s index for August was 59.9%, up slightly from 59.5% in July. The Non-manufacturing index dropped though, from 64.1% in July to 61.7% in August. It is important to remember that anything above 50% is considered expansion. We are still rapidly expanding, but the starts and stops are causing fits for many.
Industrial output in June was 100.2 it improved in July to 101.1. We will have to see how August faired when released later this month.
The long-term average for capacity utilization, widely considered an indicator of how much slack is in the economy, is 79.6%. In July 2021, capacity utilization was reported at 76.1%. This continues to increase, as recently as March, we were at 74.7%, still, off of that close to 80%, we are shooting for.
If you need an indicator of a confused market, look no further than consumer confidence. It has been a bright spot for the economy. Consumer confidence was 128.9 in June and 129.1 in July. In August, that dropped to 113.8, a major pullback from recent highs.
U.S. Labor:
We did a deep dive on the U.S. labor market in last month’s rail report. We will not rehash all of that here, but one stat we are very interested to see in next month’s report. The federal unemployment supplements ended at the beginning of September. Many states had already ended their unemployment supplements but about half of the states kept them in place. With that rolling off and the number of job openings currently at a record, we are eager to see if there is a big return to the workforce, especially in service sector jobs like restaurants and hospitality.
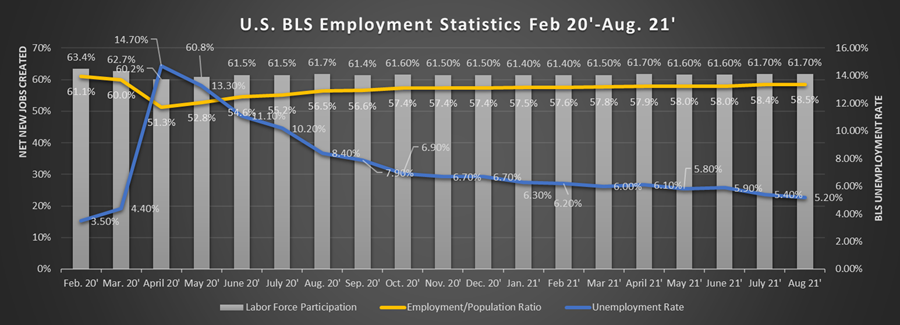
Through August, we still have 5.33 million jobs yet to be recovered from the pandemic losses of March and April 2020. The labor force participation rate or percentage of the eligible workforce employed is at 61.7%. in February 2020 that was 63.4%. The labor force participation rate shows the same, at 58.5% as of August, it was 61.1% in February 2020 before the pandemic hit.
So, if there is a lower percentage of people working and still 5.3+ million jobs to recover, why the labor shortages and labor inflation? That is a great question and one we hope to hear answers to in the coming months. Will millions of Americans return to the workforce as the enhanced unemployment benefits roll off? We will only know as time goes on.
Rail Freight Analysis:
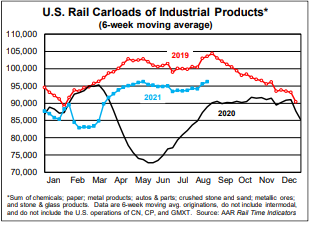
In August 2021, of the 20 freight categories the American Association of Railroads tracks, 14 of those categories were higher than August 2020. Only six categories topped their August 2019 mark.
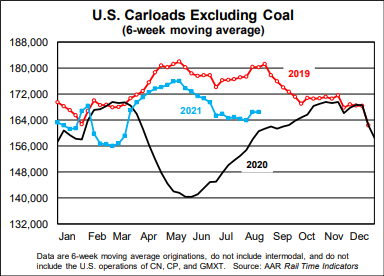
This might be the best chart to indicate overall rail loadings. 2021 has remained largely steady barring the winter storm shutdowns of February. But, as the chart above indicates, it remains stubbornly well off 2019 levels. As we move into the 4th quarter drop-off of the year, it will be interesting to see how rail traffic holds up. Will we see the normal drop at the end of the year or with record-low inventories and backlogged supply chains, will traffic continue to run at or near current levels?
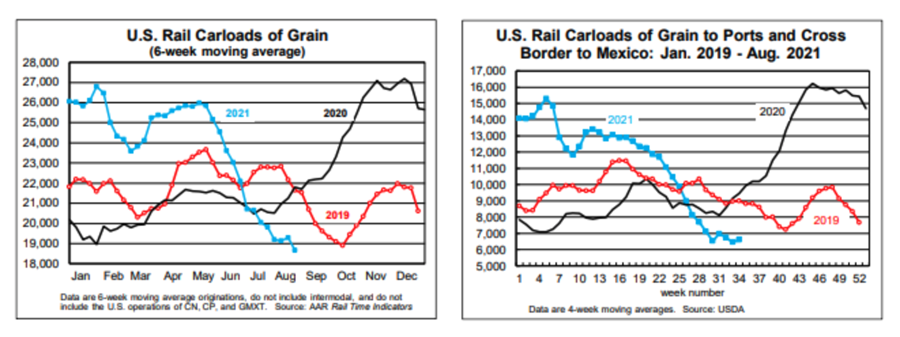
Grain, the standout of 2020 and the first half of 2021 continues to drop as exports have decreased significantly. Grain exports skyrocketed in 2020 but have since come down to long-term levels in the second half of 2021. This is almost certainly a major contributing factor to the drop in grain loadings.
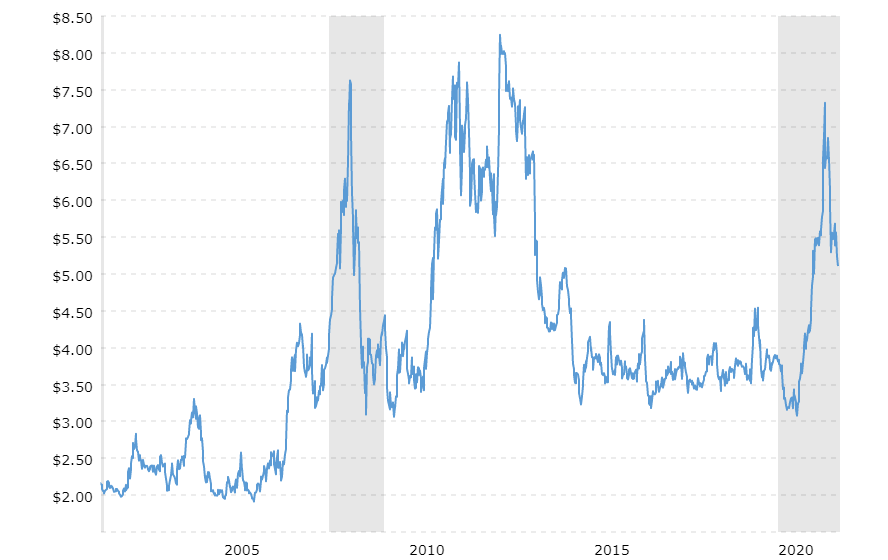
Grain, as measured by the AAR, is about 90% corn, wheat, and soybeans, with corn making up about the same as wheat and soybeans combined. Corn prices peaked on May 3, 2021, at $7.32 per bushel. Since then, they have moderated back to around $5.00 per bushel over the summer but still remain well above the average range of $3.00 - $4.50 that has been in place since 2014.
Industrial Commodities:
The sectors most likely to find a Trackmobile railcar mover in use on their site will be pleased to hear If one area seems to be gaining steam, it is the industrial commodities. “Industrial Products” are identified as the sum of autos and auto parts, chemicals, crushed stone, sand, and gravel, metallic ores, paper, primary metal products, stone, clay, and glass products.
While we are still well off 2019 levels, we have returned to similar trends and are right at the point in the year where loadings usually drop off. We’ll be interested to see if that holds true in 2021 or if current levels are maintained.
Breaking down the sector Metals and Chemicals continue to be two strong contributing factors to the industrial sector’s strength.
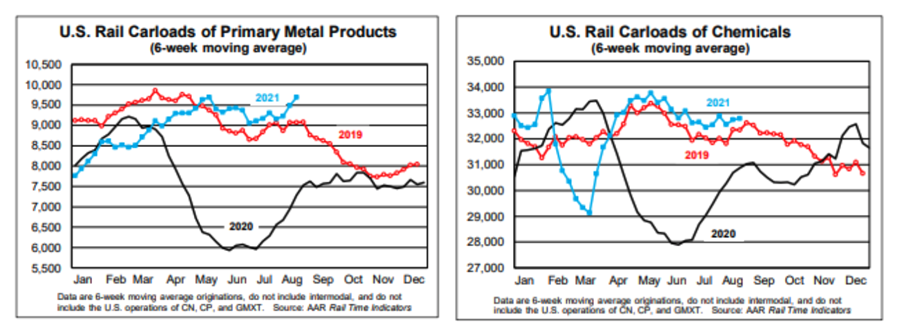
Chemicals were up 5.7% over August 2020 and are the most ever chemical carloads through August.
Primary metal products were up 26.1% over August 2020 with scrap and metallic ores posting similar results.
Overall the rail picture continues to be a mixed one. We certainly would not call it struggling, but strong does not feel right either. We’ll see what future months hold.
Federal Reserve Weekly Economic Index:
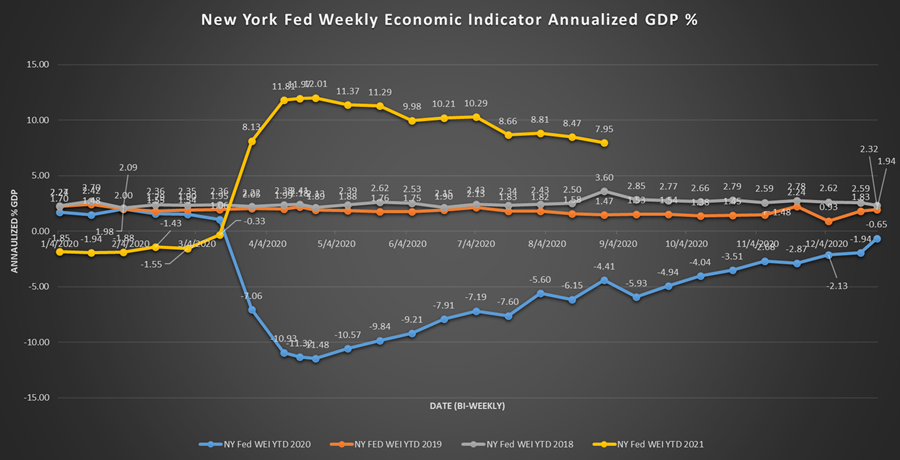
We always close with the Fed economic index. Through the summer WEI readings have continued at a strong pace. Remember, GDP is calculated as a percentage gain over the previous year’s rate. Accordingly, we expect to see this number continuing to trend toward the mean. The question is: How quickly does it drop?
We will continue to be here to support our customers with Trackmobile™, Modjoul™ smart belt, compressor, crane, and chiller needs.
We have over 60 years as a Trackmobile Railcar Mover dealer and industrial Engineered equipment systems provider. We remain open and ready to support the operations of our customers. We have a fleet of Trackmobiles available for rental. Our service technicians are available 24/7/365. Our Trackmobiles, cranes, and compressors operate in some of the most critical industries supporting our economy. Our team stands ready to support your application in any way we can.