June / July Rail Update
July Rail Traffic 2nd Lowest on Record
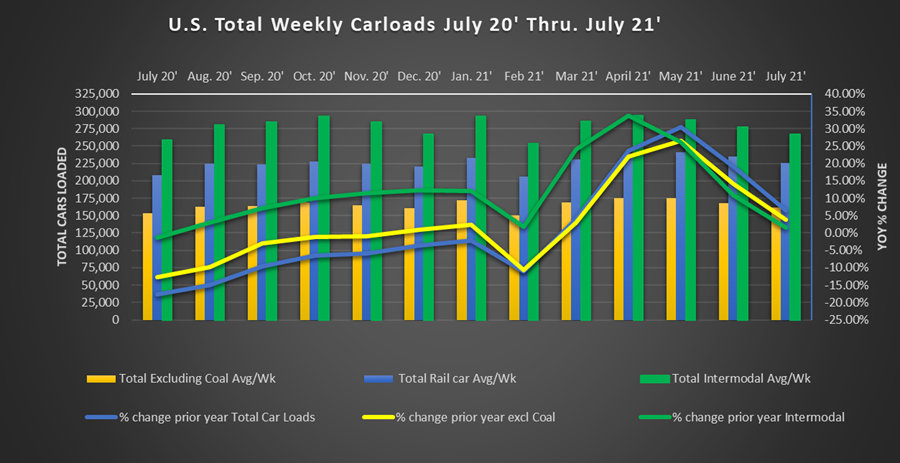
Over the summer, U.S freight traffic has continued its recovery, albeit at a slower pace. We are now lapping one full year since the heaviest lockdowns began lifting. June continued the strong recovery expected from a locked-down economy, but July showed some cracks. While up 6.6% over 2020, July U.S. rail volumes were down 13.3% from July 2019 -- not exactly back to normal. July 2021 rail volumes averaged 226,168 loaded cars per week. According to the American Association of Railroads, that is the second-lowest July rail volume since they began keeping records in 1988. Only July 2020 was lower.
Summer Rail Traffic:
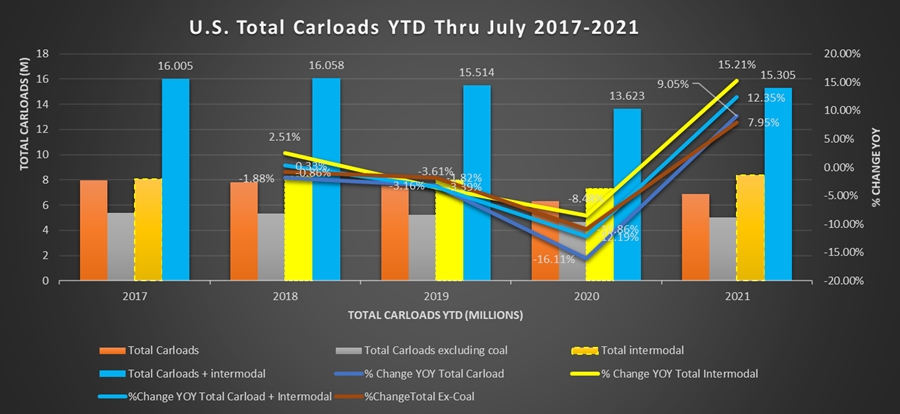
We have been doing our best to highlight comparisons to 2019 as much as 2020 to provide contrast against a more “normal” environment. Year to date U.S. ex-coal carloads are up 7.9% over July 2020. Compared with this point in 2019, total ex-coal railcar loadings are down -3.8%. There are many factors that likely contribute to that.
Not the least of the factors to consider when comparing 2021 and 2019 numbers were parts of the U.S. still experiencing lockdowns in the first couple of months of the year, and the heightened concern over the Delta variant’s recent spike. When it comes to annual totals, a slow start makes ground hard to make up. That said, an economy so spring-loaded to rebound still down from 2019 is not a great sign. We’ll continue tracking it through the rest of the year.
Economic Summary:
Perhaps the largest indicator of overall economic progress, The Bureau of Economic Analysis released its preliminary reading of 6.5% GDP growth in the 2nd quarter of 2021. Under any other circumstances that would be a phenomenal number. In Q2 it actually missed analyst estimates which were closer to 8.5% annual GDP growth. Covid variants and restrictions still affecting large parts of the world, as well as rising Delta variant cases are no doubt contributing. Something as big as the U.S. economy never boils down to any one circumstance. Other issues like bogged down supply chains and labor market shortages are likely also contributing to the miss.
The labor shortage is hopefully making up some ground. According to the Bureau of Labor Statistics, in April and May, the U.S. created net new jobs of 269,000 and 614,000. That has accelerated this summer. June reported non-farm payrolls were 938,000 additions and July followed that up with 943,000 net new jobs.
Other economic indicators point to varying levels of expansion. Some are still accelerating or increasing the rate of expansion, some are decelerating, but pretty much all of them are still pointing to an expanding U.S. economy.
Industrial output in May was 99.7, and in June, 100.1. This has continued to trickle up month by month. It still remains 1.2% below the most recent reading before the pandemic began.
The long-term average for capacity utilization, widely considered an indicator of how much slack is in the economy, is 79.6%. In June 2021, C.U. was reported at 75.4%.
Consumer confidence has been a bright spot for the economy. Despite an increasing Delta variant, consumer confidence was 128.9 in June and 129.1 in July. As recently as February 2021, that number was 95.2. Consumer confidence is seen as an indicator of upcoming spending and accordingly economic demand. Confident consumers are more likely to spend on discretionary purchases like clothing, meals out, furniture, and other consumer items.
U.S. Labor:
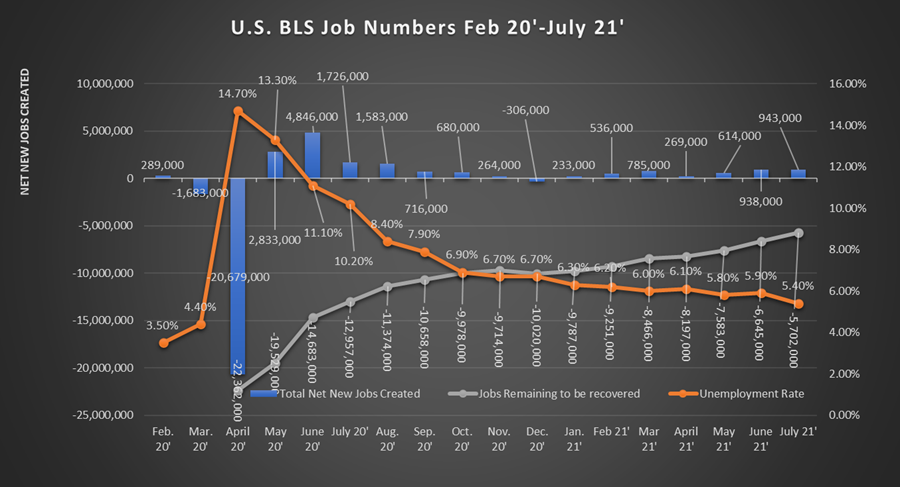
Digging deeper into the employment picture, the chart above shows the BLS unemployment rate “Orange Line” and the net new jobs “Blue Bar” from February 2020 through July 2021. The gray line shows the total net remaining jobs to be recovered from the losses in March and April 2020. Over 22 million jobs were lost during the first two months of the lockdown. Today there are just over 5.7 million jobs yet to be recovered.
In February 2020, the unemployment rate was 3.5%, today it sits at 5.4%. With 5.7 million jobs left to recover and an employment rate two full percentage points higher than it was before Covid, where are all the workers? This is a question plaguing analysts, companies, and many others. Some point to the enhanced federal unemployment benefits that are set to roll off at the beginning of September. Some say workers have dropped out of the labor force not to return. One thing is for sure, the total number of U.S. persons employed peaked in February 2020 at 158.7 million (Redline). As of July 2021, that number is 152.6 million people working -- 6.1 million fewer people working in the U.S. than before Covid.
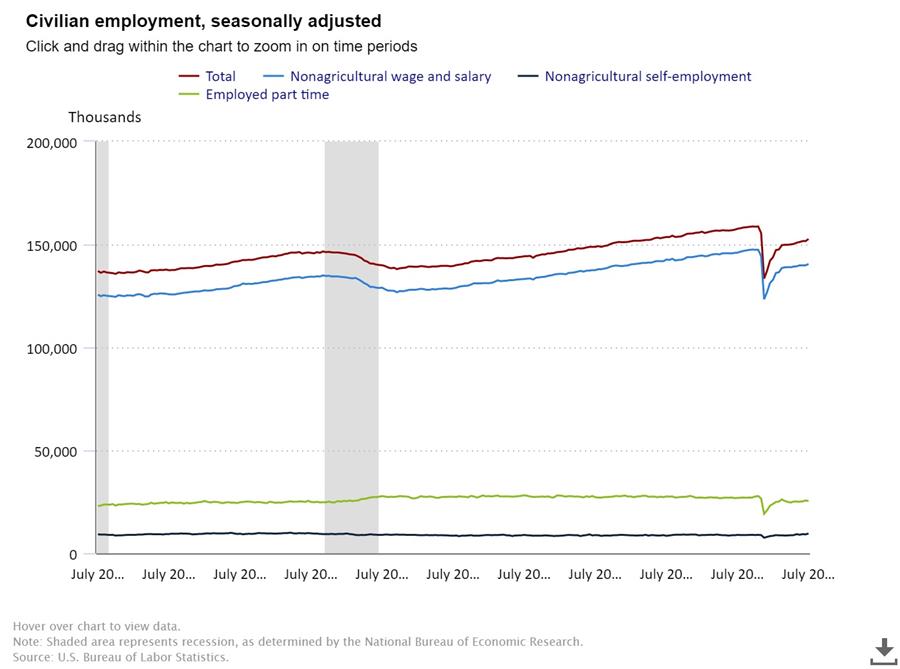
This is further seen in a labor force participation rate (Gray bar) that stood at 63.4% in February 2020 vs. 61.7% as of July 2021. Keep in mind labor force participation is based on the number of eligible workers in the U.S. It excludes people under 16, in nursing homes, and several other factors. In short. less eligible people are working, whatever the reason may be.
Rail Freight Analysis:
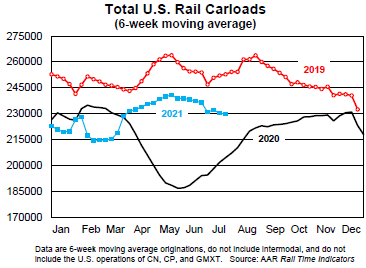
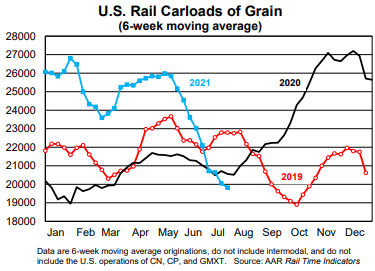
In July 2021, of the 20 freight categories the American Association of Railroads tracks, 10 of those categories were higher than July 2020. Only five categories topped their July 2019 mark. This is possibly best born out in the six-week moving average of U.S. carloads for 2019-2021. You see 2021 trending well above the sharp dip in 2020 (black line), but it has remained below 2019 levels at every point this year. We mentioned in a previous letter that rail traffic tends to drift down in the summer. There was hope with pent-up demand and continued reopening, 2021 would break this trend. It does not appear that has been the case.
For our savvy readers familiar with our discussions on loadings excluding coal vs all rail traffic; 2021 is the lowest year to date number of railcar loads since 2013, excluding 2020.
One of the biggest factors hurting railcar loads is autos. In July 2021 loadings of motor vehicles and parts were 20.7% lower than July 2020, note that we said July 2020, not July 2019. Parts shortages continue to plague auto production. We have discussed this at length in previous issues.
Grain also finally took a spill. In July grain shipments were down 7.3% from July 2020. Perhaps more alarming is the speed at which grain shipments have declined. Grain shipments are a major export and the ongoing port delays and a Delta variant rising around the world may be a reason for the steep decline.
Chemicals continue to be a strong contributor to 2021 railcar loads. In July 2021 railcar loads of chemicals were up 5.8% over July 2020, and largely in line with 2019. 2021
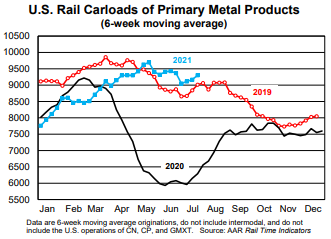
Primary metal products like steel, scrap metal, and similar products are another strong point in 2021. Up a whopping 36.4% over the depths seen in July 2020. Better yet, primary steel has averaged above 2019 levels since May. We are hopeful this trend continues as it is indicative of increased infrastructure and building in the country.
Federal Reserve Weekly Economic Index:
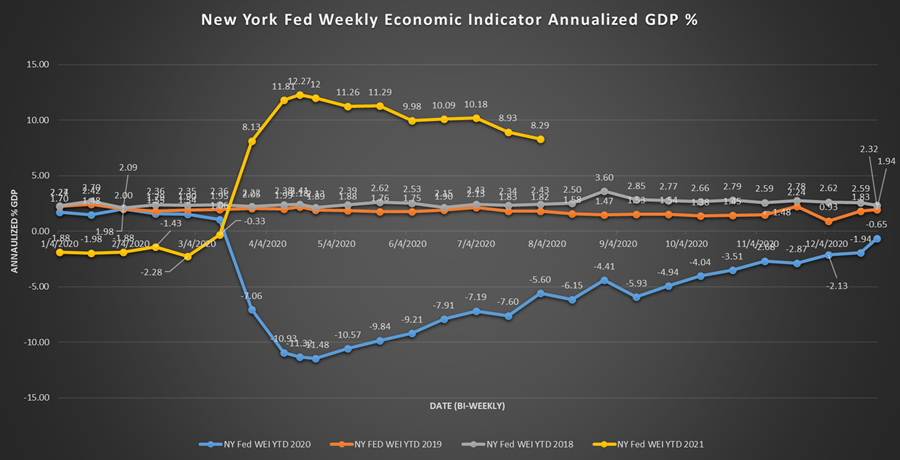
We always close with our economic index. Through the summer WEI readings have continued at a strong pace. Remember, GDP is calculated as a percentage gain over the previous year’s rate. Accordingly, we expect to see this number continuing to trend toward the mean. The question is: How quickly does it drop?
We will continue to be here to support our customers with Trackmobile™, Modjoul™ smart belt, compressor, crane, and chiller needs. We have over 60 years as a Trackmobile Railcar Mover dealer and industrial Engineered equipment systems provider. We remain open and ready to support the operations of our customers. We have a fleet of Trackmobiles available for rental. Our service technicians are available 24/7/365. Our Trackmobiles, cranes, and compressors operate in some of the most critical industries supporting our economy. Our team stands ready to support your application in any way we can.