May 2021 in the Rail Industry
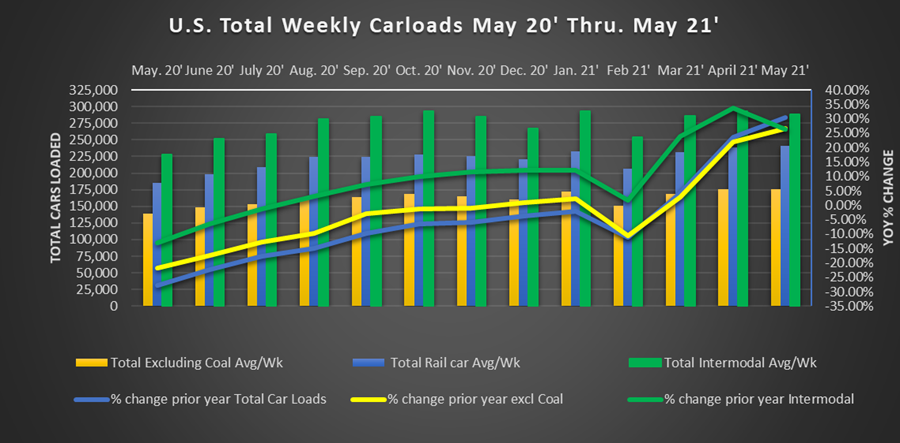
May was another strong month for the rail industry. Continuing with April, we have now lapped the heaviest lockdown months of the pandemic. In May 2021, U.S. total railcar loads averaged 241,089 weekly. Carloads were up 30.4% over May 2020. Perhaps more importantly, this was the best month since October 2019. Ex-coal carloads were similar at 175,516, up 26.6% over May 2020. Carloads have largely returned to near pre-pandemic levels.
Railcar Loadings Analysis:
In May 2021, 18 of the 20 AAR commodity categories were up compared with May 2020. Considering where we were in May 2020, that does not come as a surprise. While it may be expected, it is still welcome news. That is especially true with an economy that has shown some mixed signals, specifically the May jobs report, and the highest inflation print since the great recession. Excluding coal shipments, May 2021 was 1.2% lower than May 2019. Given the economy we were in back then, that is not a bad mark to shoot for:
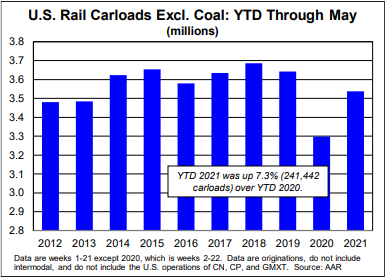
You can see Year to date ex-coal carloads are still below every year since 2014 but remember the winter storm shutdowns of February. We expect to see this year-to-date number get closer to pre-pandemic years as 2021 goes on; that’s assuming the worst is past us and there are no new lockdowns or pandemic-related closings.
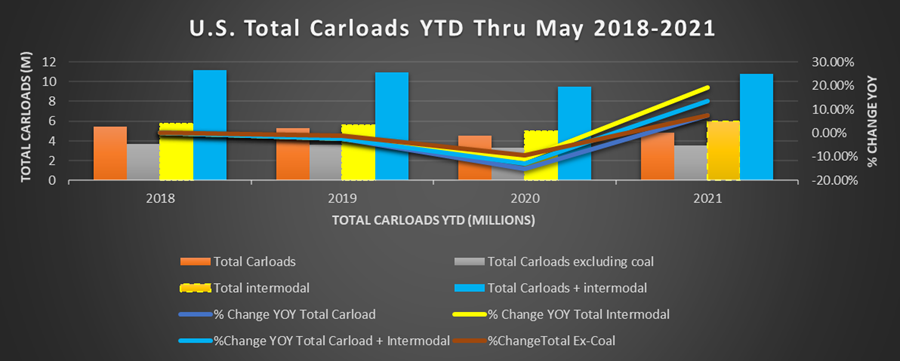
Intermodal continued their strong march. In May 2021, intermodal loads averaged 287,956 containers and trailers per week. From January through May 2021 more intermodal carloads have been transported in the U.S. than ever recorded. There is not a lot to say on this topic. Anecdotal reports of port congestion clearing up do not show any signs of intermodal shipments slowing down.
We mentioned 18 of 20 carload categories were higher in May 2021 vs 2020. Recent month’s usual suspects continued to top the strong categories.
Grain shipments were up 18.8% over May 2020. Through May 2021 534,814 grain carloads have been moved in the U.S. that is the highest first five-month number since 1990.
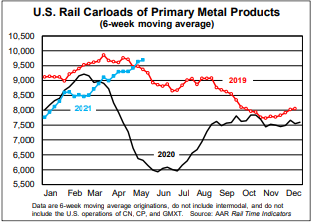
Primary metal products had another strong month. In May primary metal products were up 60.9% over May 2020. Perhaps more importantly, year to date almost 190,000 steel carloads have been produced. Through May, 2017,2018, and 2019 were all between 190,000-200,000 at this point in the year. This time last year, we had just crossed the 160,000 carloads threshold. The snapback is perhaps no more elegantly illustrated than by looking at the six week moving average. You’ll notice metal car loads started dropping off right around this time in 2019. So far this year metal carloads at still trending up. If this continues, or even maintains current levels. We could end up shipping more metal carloads in 2021 than we did in 2019.
Other commodities like chemicals, forest products, and petroleum products all notched gains over May 2020.
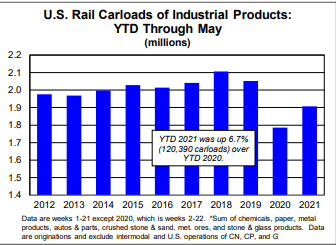
Industrial products are an aggregate category consisting of seven of the major commodity categories. It represents a wide brush of the U.S. industrial economy. It serves as a good gauge for overall economic strength in the underlying economy. In May industrial products averaged 96,520 carloads per week. That is the highest weekly average since September 2019.
The Economy:
Jobs:
After what could, at best, be described as a disappointing April jobs report. The May jobs report rebounded to 559,000 net new jobs created. That was still below most analyst estimates but is more indicative of a rebounding economy. Besides the Jobs report, the biggest noteworthy report of May was inflation, more on that below.
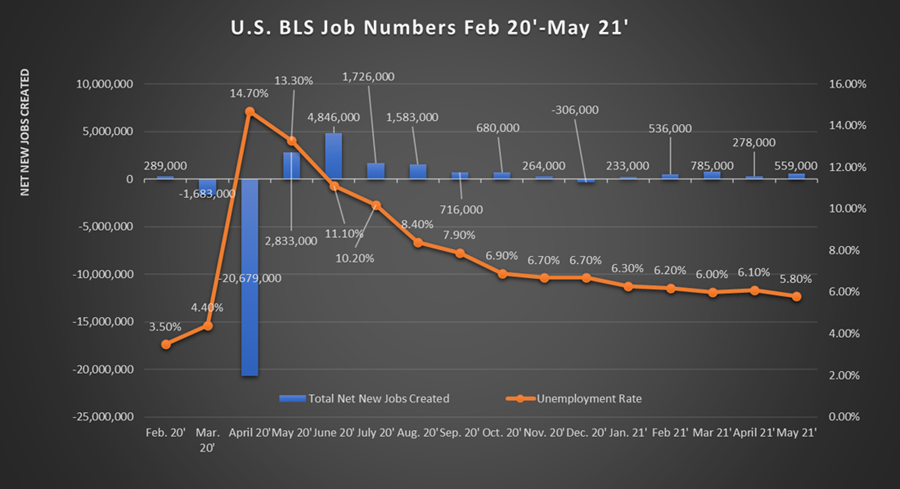
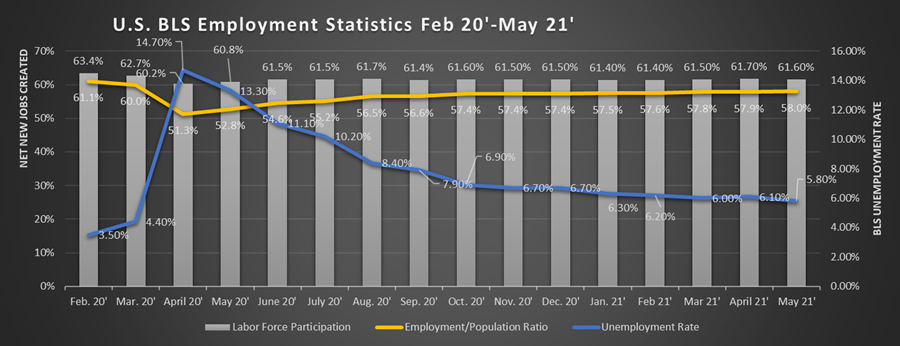
As the chart above shows, the employment situation has improved dramatically since the highs of a year ago. We are back under 6.0% in the headline unemployment rate. Remember though, the employment rate only measures those actively looking for work. The report fails to site the full 3.0% drop in the population/employment or the 2.1% drop we have had in the labor force participation rate since February 2020. That means a lot of people have dropped out of the workforce. We’ll continue to monitor whether they return to active employment as months roll on.
The consumer price index for May rose 5% from pricing in May 2020. That is the fastest inflation pace since August 2008. Core inflation, which excludes volatile food and energy prices was up 3.8%. For comparison, the CPI from 2015-2020 never touched higher than approximately 2.5% and was under 2.0% for much of that time.
Federal Reserve chair Jerome Powell has continued to state publicly that they believe inflation to be “transitory” or temporary. Whether that bet comes true we will see it in the coming months.
Economic Indicators:
Despite the jobs report. Economic indicators remain largely positive. We reported last month, the initial report for U.S. GDP in Q1 2021 was 6.4%. Many economists are calling for a 7% or better GDP in 2021. The last +7% GDP year for the U.S. was 1984. Perhaps a better comparison than that, the late nineties especially 1997-2000 all 4 years were over 4% GDP increase before the economy slowed in the early 2000s. Could the first half of the 2020s follow something similar?
The purchasing managers' index was 61.2% in May, remaining over that strong 60% number. Anything above 50% indicates expansion. Above 60% indicates a rapidly expanding economy.
Industrial output in May was up .8%. Manufacturing output was up .9% to 99.9 in May from April. Capacity utilization has remained fairly steady over the last couple of months at: 75.3% in January, 72.7% in February, 74.4% in March, 74.9% in April, and now 75.2% in May. The trend continues to be in the right direction.
Autos:
Autos continue to be plagued by the chip shortage. As we noted last month, a quick survey of your local car lot will tell you that. In May sales remained high, as inventory remained low. An annualized rate of 17.0 million cars was sold in May 2021, down from the 18+ numbers of March and April but still very strong by historical standards.
Housing:
Housing and autos seem to be walking in lockstep. Housing starts were up 3.6% month over month to a seasonally adjusted rate of 1.572 million homes. Expectations were for 1.63 million starts. High lumber prices and commodity shortages continue to plague the market, that said lumber prices have begun turning over in the last month. As more mills are back online and production is increasing, there is hope some relief may be in sight for the economically sensitive sector. This bodes well as the largest generation in history, millennials, are now into their prime family formation years.
Federal Reserve Weekly Economic Index:
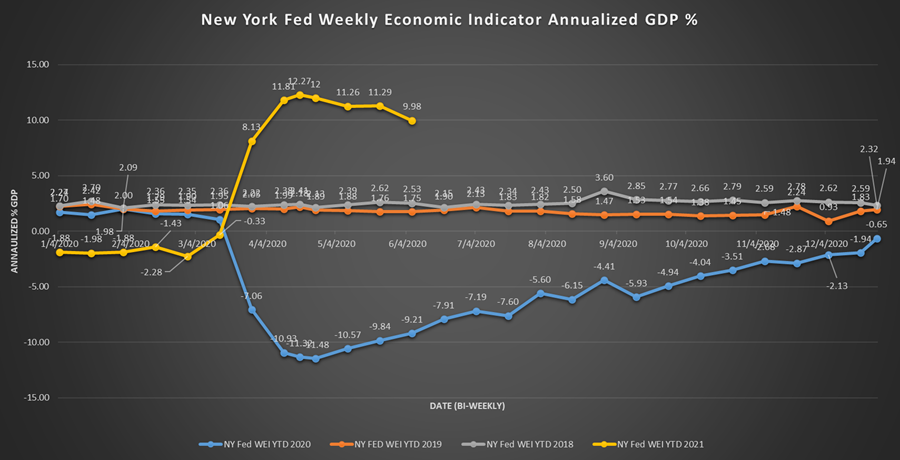
We always close with our economic index. Now against the Pandemic comparisons, the WEI remains strong at or above 10% annualized GDP on a weekly basis. If numbers stay where they have for the remainder of June. We expect a very strong GDP print for the second quarter of 2021. We’ll see if that continues as the year moves forward.
We will continue to be here to support our customers with Trackmobile™, Modjoul™ smart belt, compressor, crane, and chiller needs.
We have over 60 years as a Trackmobile Railcar Mover dealer and industrial Engineered equipment systems provider. We remain open and ready to support the operations of our customers. We have a fleet of Trackmobiles available for rental. Our service technicians are available 24/7/365. Our Trackmobiles, cranes, and compressors operate in some of the most critical industries supporting our economy. Our team stands ready to support your application in any way we can.