January & February Rail Industry Update
New Year Who Dis?
2021 January February Rail Industry Review
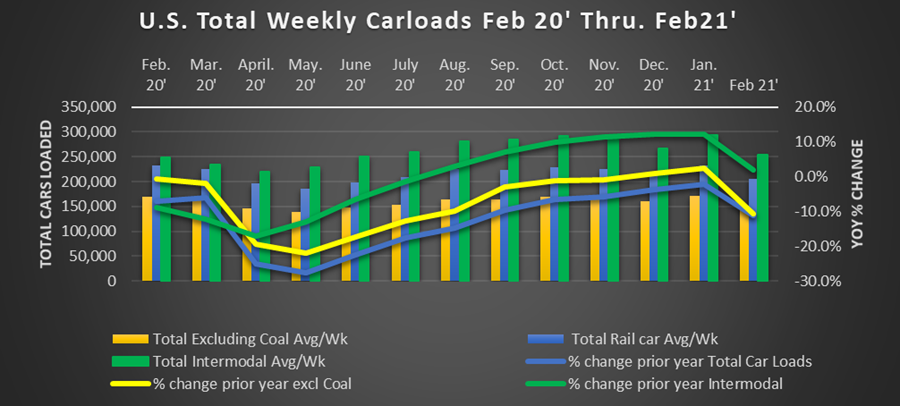
The rail industry in the first two months of 2021 is acting much like the rail industry in 2020. Who knows what is next? January ex-coal railcar loadings were actually up 2.3% from January 2020. Remember that is still pre-pandemic too. February with its unusual and widespread cold put a serious halt on railcar loadings. We’ll leave blaming the weather to the experts. So here are the numbers. February carloads averaged 206,159 per week. Those are readings in line with April and May of last year. In other words, awful.

January Focus:
232,576 cars per week are nothing to sneeze at. It’s the highest monthly reading we’ve had in a year. Even more, the 2.3% increase in noncoal cars is something of a trend. January 2021 noncoal U.S. loadings were higher than 2018, 2019, or 2020. Of the 20 commodity categories tracked by the AAR. 10 categories had higher volumes in January than in January 2020. The long and short. Domestic freight traffic continues to improve and point to some encouraging signs.
What a difference a month can make. February’s weekly average of 206,159 was -11.1% off February 2020. What’s worse. Ex-coal loadings were -10.6%. So we can’t blame this on Coal’s sector-specific issues. Only three of the 20 commodity groups had year-over-year gains in February. We will see if March is a snapback as temperatures rise into spring.
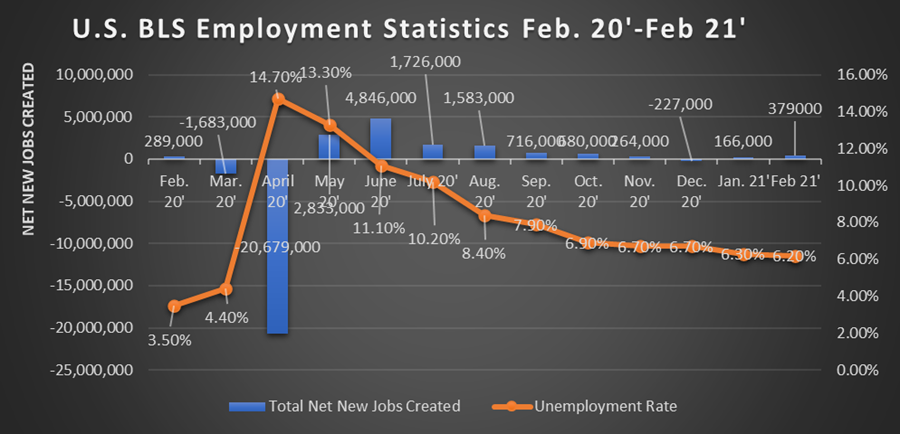
On the economic front. We returned to positive job growth in January and February. Net new farm payrolls were revised to +166,000 in January. February net new jobs were +379,000. Most of the new jobs were in the service and hospitality sectors. The increase was seen as Covid related lockdowns begin lifting from the winter. The number of net lost jobs from Corona remains over nine million. The unemployment rate in February remained little changed at 6.2%. Many economic pundits believe the economy is on a strong footing going into 2021 As we approach the end of the first quarter. We look forward to monitoring the progress.
Railcar Loading Analysis:
Highlight Categories:
Grain in January 2021 was up 40% from January 2020. No, that is not a typo. While grain is a largely volatile number. January was the largest month of grain loadings recorded since 2007. It followed February with a 15.7% gain over February 2021. It is safe to say it has been a bumper crop.
Chemicals, an important indicator for the overall economy. Chemicals touch almost every swath of the economy. In January Chemicals averaged 34,075 carloads per week. a 4.4% increase over January 2020. However, in February they were down 10.5% from February 2020.
Carloads of Iron and steel scrap were up 5.0% in January year over year. As seen in the chart below Steel prices have skyrocketed as the economy has begun reopening and pent-up demand begins hitting all at once. The chart below shows prices for US Midwest hot-rolled coil steel from 2008-today. They cooled off in February, but less than other commodity categories.
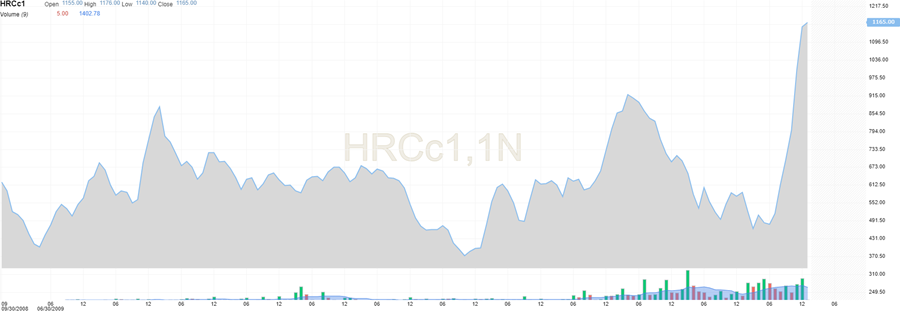
The price of steel detailed here now stands at double where it was just one year ago. As production comes back online and catches up with surging demand. We will see if the ugly bear of inflation has begun. Steel prices are just one commodity that is at near-record highs.
Economic Indicators:
With a fourth-quarter initial reading of +4.1%. a near-normal January followed by a pandemic like February. This yo-yo keeps spinning. We are hopeful we will see a big comeback in March loadings. That February was transitory as the weather and Covid affected states. Time will tell.
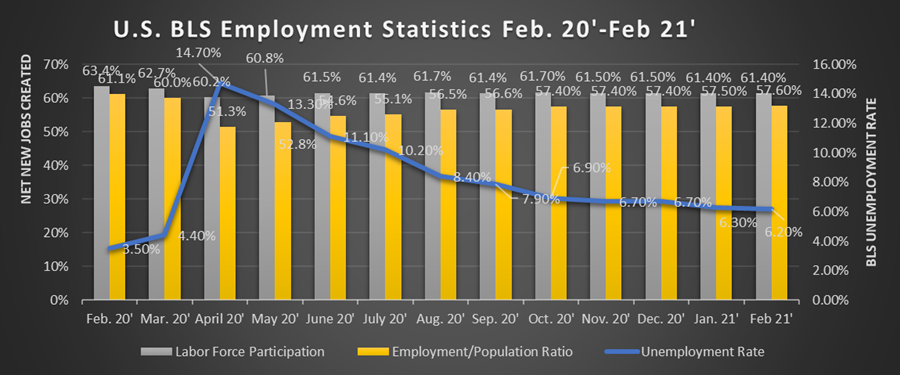
We’ve touched on employment already with +500,000 jobs through the first two months of 2021. We are moving in the right direction. Workforce participation still remains several points off of pre-pandemic levels though. Indicative of an economy that has a lot of workforce slack and room for growth.
Other interesting economic indicators:
Purchasing managers index in February hit recent highs of 60.8%. Capacity utilization for January continues to climb to 75.6% it's highest reading in several months.
Consumer confidence for February is up to 91.3. an improvement from January and December but well off the highs of September as we came off the first Covid peak.
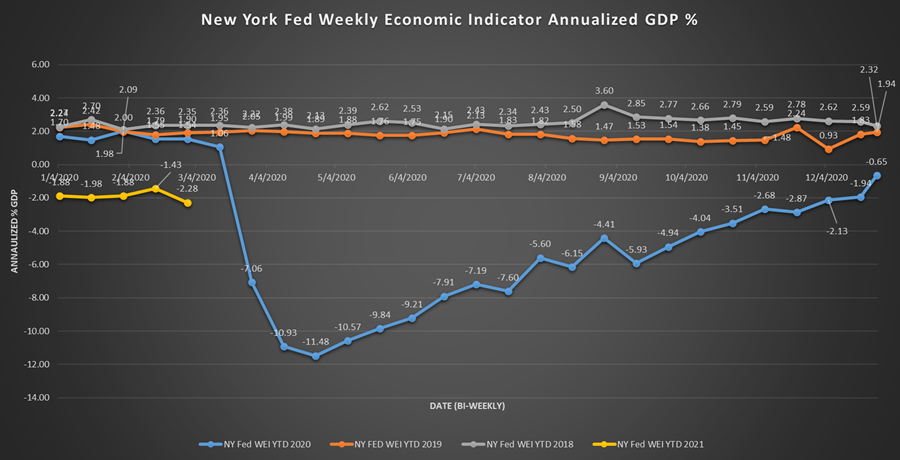
Finally, the Fed’s Weekly Economic Index. Perhaps indicative of the loadings we saw in February. The WEI has slipped back down as low as -2.28% in the recent weekly reading. The uptrend has tapered off into the new year. We’ll see where it moves going forward.
We will continue to be here to support our customers with Trackmobile™, Modjoul™ smart belt, compressor, crane, and chiller needs. We have over 60 years as a Trackmobile Railcar Mover dealer and industrial Engineered equipment systems provider. We remain open and ready to support the operations of our customers. We have a fleet of Trackmobiles available for rental. Our service technicians are available 24/7/365. Our Trackmobiles, cranes, and compressors operate in some of the most critical industries supporting our economy. Our team stands ready to support your application in any way we can.